Fig. 11
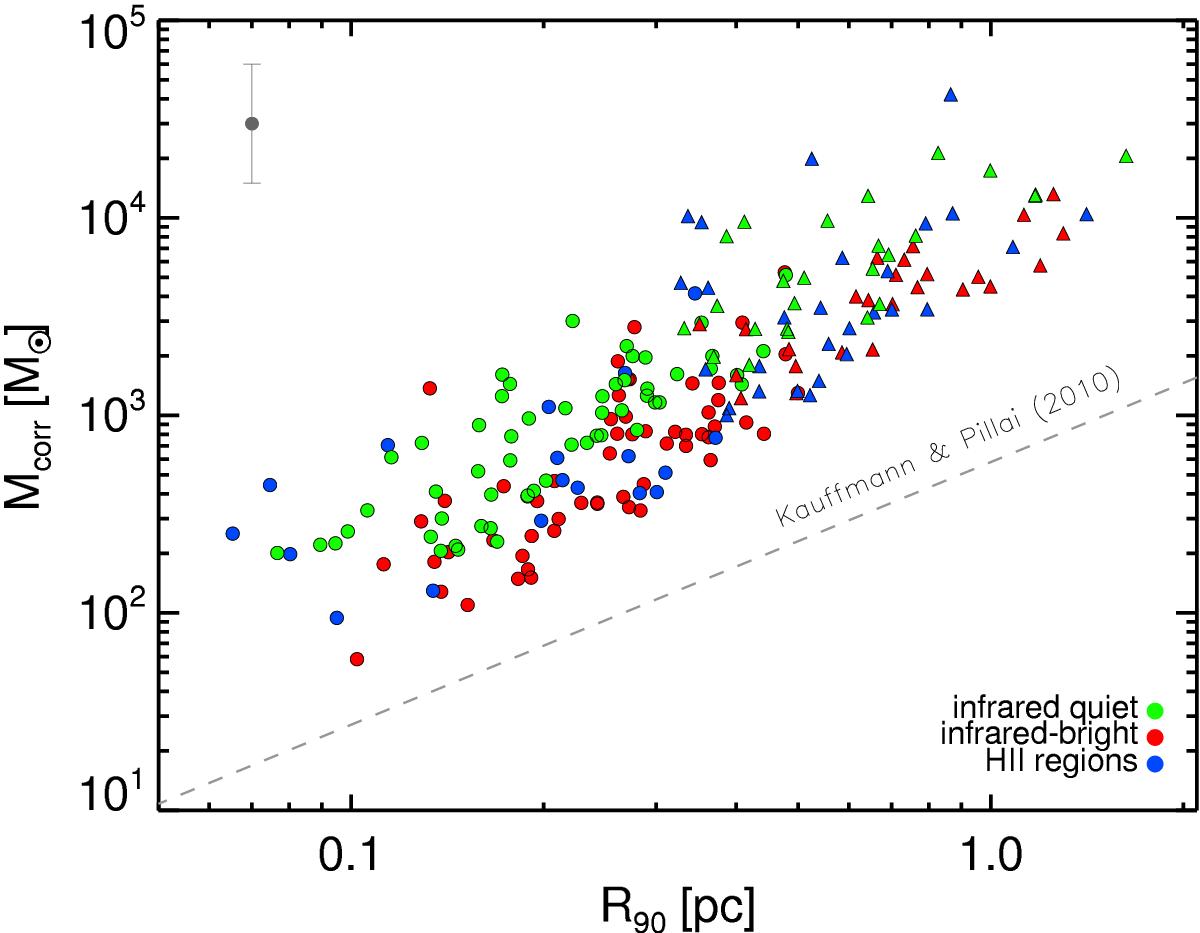
Temperature corrected mass estimates (using Td = 30 K for the infrared-bright clumps) versus deconvolved physical size (R90) from Sect. 2.3. Dashed lines show the relation of Kauffmann et al. (2010) scaled to the Ossenkopf & Henning (1994) dust opacity following Dunham et al. (2011). In the upper left corner we show the factor of two uncertainty in the mass estimate. Colours are the same as in Fig. 7.
Current usage metrics show cumulative count of Article Views (full-text article views including HTML views, PDF and ePub downloads, according to the available data) and Abstracts Views on Vision4Press platform.
Data correspond to usage on the plateform after 2015. The current usage metrics is available 48-96 hours after online publication and is updated daily on week days.
Initial download of the metrics may take a while.