Free Access
Fig. 1
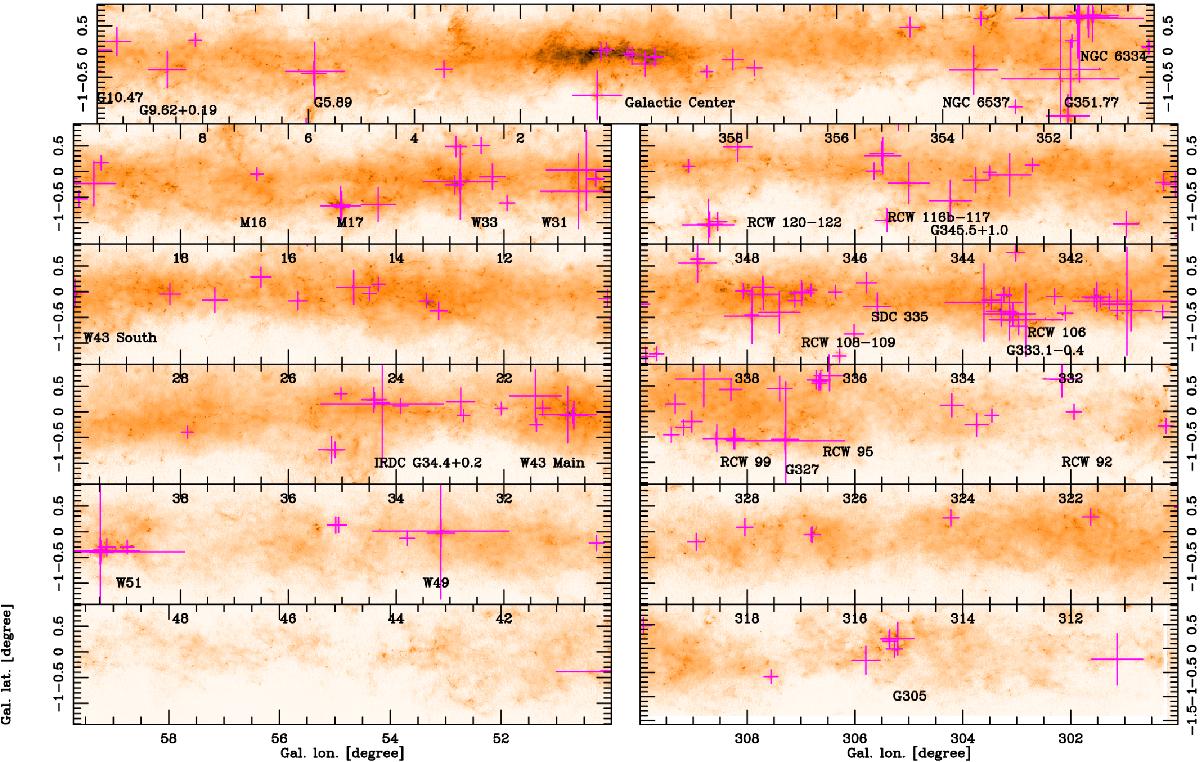
Overview of the Galactic distribution of the sample and the associated molecular clouds. Figure adopted from Csengeri et al. (2016b) showing the ATLASGAL-Planck combined view of the inner galaxy. Magenta crosses show the location of the sources. The size of the symbols scales linearly with the peak flux density.
Current usage metrics show cumulative count of Article Views (full-text article views including HTML views, PDF and ePub downloads, according to the available data) and Abstracts Views on Vision4Press platform.
Data correspond to usage on the plateform after 2015. The current usage metrics is available 48-96 hours after online publication and is updated daily on week days.
Initial download of the metrics may take a while.