| Issue |
A&A
Volume 600, April 2017
|
|
|---|---|---|
| Article Number | A73 | |
| Number of page(s) | 13 | |
| Section | Stellar structure and evolution | |
| DOI | https://doi.org/10.1051/0004-6361/201630376 | |
| Published online | 04 April 2017 | |
Pulsating low-mass white dwarfs in the frame of new evolutionary sequences
IV. The secular rate of period change
1 Grupo de Evolución Estelar y Pulsaciones, Facultad de Ciencias Astronómicas y Geofísicas, Universidad Nacional de La Plata, Paseo del Bosque s/n, 1900 La Plata, Argentina
2 Instituto de Astrofísica La Plata, CONICET-UNLP, Paseo del Bosque s/n, 1900 La Plata, Argentina
e-mail: This email address is being protected from spambots. You need JavaScript enabled to view it.
; This email address is being protected from spambots. You need JavaScript enabled to view it.
; This email address is being protected from spambots. You need JavaScript enabled to view it.
Received: 30 December 2016
Accepted: 30 January 2017
Abstract
Context. An increasing number of low-mass (M⋆/M⊙ ≲ 0.45) and extremely low-mass (ELM, M⋆/M⊙ ≲ 0.18−0.20) white-dwarf stars are being discovered in the field of the Milky Way. Some of these stars exhibit long-period g-mode pulsations, and are called ELMV variable stars. Also, some low-mass pre-white dwarf stars show short-period p-mode (and likely radial-mode) photometric variations, and are designated as pre-ELMV variable stars. The existence of these new classes of pulsating white dwarfs and pre-white dwarfs opens the prospect of exploring the binary formation channels of these low-mass white dwarfs through asteroseismology.
Aims. We aim to present a theoretical assessment of the expected temporal rates of change of periods ( ) for such stars, based on fully evolutionary low-mass He-core white dwarf and pre-white dwarf models.
Methods. Our analysis is based on a large set of adiabatic periods of radial and nonradial pulsation modes computed on a suite of low-mass He-core white dwarf and pre-white dwarf models with masses ranging from 0.1554 to 0.4352 M⊙, which were derived by computing the non-conservative evolution of a binary system consisting of an initially 1 M⊙ ZAMS star and a 1.4 M⊙ neutron star companion.
Results. We computed the secular rates of period change of radial (ℓ = 0) and nonradial (ℓ = 1,2) g and p modes for stellar models representative of ELMV and pre-ELMV stars, as well as for stellar objects that are evolving just before the occurrence of CNO flashes at the early cooling branches. We find that the theoretically expected magnitude of of g modes for pre-ELMVs is by far larger than for ELMVs. In turn, of g modes for models evolving before the occurrence of CNO flashes are larger than the maximum values of the rates of period change predicted for pre-ELMV stars. Regarding p and radial modes, we find that the larger absolute values of correspond to pre-ELMV models.
Conclusions. We conclude that any eventual measurement of a rate of period change for a given pulsating low-mass pre-white dwarf or white dwarf star could shed light about its evolutionary status. Also, in view of the systematic difficulties in the spectroscopic classification of stars of the ELM Survey, an eventual measurement of could help to confirm that a given pulsating star is an authentic low-mass white dwarf and not a star from another stellar population.
Key words: asteroseismology / stars: oscillations / white dwarfs / stars: evolution / stars: interiors / stars: variables: general
© ESO, 2017
1. Introduction
Low-mass (M⋆/M⊙ ≲ 0.45) white dwarfs (WD) are probably produced by strong mass-loss episodes at the red giant branch phase of low-mass stars in binary systems before the He-flash onset (Althaus et al. 2010). Since He burning is avoided, they are expected to harbor He cores, in contrast with average-mass (M⋆ ~ 0.6 M⊙) C/O-core WDs. In particular, binary evolution is the most likely origin for the so-called extremely low-mass (ELM) WDs, which have masses M⋆ ≲ 0.18−0.20 M⊙. The evolution of low-mass WDs is strongly dependent on their stellar mass and the occurrence of element diffusion processes (Althaus et al. 2001). Althaus et al. (2001, 2013) and Istrate et al. (2016b) have found that element diffusion leads to a dichotomy regarding the thickness of the H envelope, which translates into a dichotomy in the age of low-mass He-core WDs. Specifically, for stars with M⋆ ≳ 0.18−0.20 M⊙, the WD progenitor experiences multiple diffusion-induced CNO thermonuclear flashes that consume most of the H content of the envelope, and as a result, the remnant enters its final cooling track with a very thin H envelope. The resulting object is unable to sustain substantial nuclear burning while it cools, and its evolutionary timescale is rather short (~107−108 yr). On the contrary, if M⋆ ≲ 0.18−0.20 M⊙, the WD progenitor does not experience H flashes at all, and the remnant enters its terminal cooling branch with a thick H envelope. In this case, residual H nuclear burning via pp-chain becomes the main energy source, that ultimately slows down the evolution of the star, in which case the cooling timescale is of the order of ~109 yr. The age dichotomy has been also suggested by observations of those low-mass He-core WDs that are companions to millisecond pulsars (Bassa et al. 2003).
In the past few years, numerous low-mass WDs, including ELM WDs, have been detected through the ELM survey and the SPY and WASP surveys (see Koester et al. 2009; Brown et al. 2010, 2012; Maxted et al. 2011; Kilic et al. 2011, 2012, 2015; Brown et al. 2013; Gianninas et al. 2014, 2015; Brown et al. 2016a,b). The interest in low-mass WDs has been greatly promoted by the discovery of pulsations in some of them (Hermes et al. 2012, 2013c,a; Kilic et al. 2015; Bell et al. 2015, 2016)1. The discovery of pulsating low-mass WDs (hereinafter ELMVs2) constitutes a unique chance for probing the interior of these stars and eventually to test their formation scenarios by employing the methods of asteroseismology. Theoretical adiabatic pulsational analyses of these stars (Steinfadt et al. 2010; Córsico et al. 2012c; Córsico & Althaus 2014a) show that g modes in ELM WDs are restricted mainly to the core regions, providing the chance to constrain the core chemical structure. Also, nonadiabatic stability computations (Córsico et al. 2012c; Van Grootel et al. 2013; Córsico & Althaus 2016) show that many unstable g and p modes are excited by a combination of the κ−γ mechanism (Unno et al. 1989) and the “convective driving” mechanism (Brickhill 1991), both of them acting at the H-ionization zone. In addition, the ε mechanism due to stable H burning could contribute to destabilize some short-period g modes in ELM WDs (Córsico & Althaus 2014b).
Apart from ELMVs, pulsations in several objects that are likely the precursors of low-mass WD stars have been detected in the last years (Maxted et al. 2013, 2014; Zhang et al. 2016; Gianninas et al. 2016; Corti et al. 2016)3. Nonadiabatic stability computations for radial modes (Jeffery & Saio 2013) and nonradial p and g modes (Córsico et al. 2016a; Gianninas et al. 2016; Istrate et al. 2016a) have revealed that the excitation of pulsations in these pre-WDs is the κ−γ mechanism acting mainly at the zone of the second partial ionization of He, with a weaker contribution from the region of the first partial ionization of He and the partial ionization of H. So, the abundance of He in the envelopes of this new class of pulsating stars (hereinafter pre-ELMVs4) is a crucial ingredient for destabilizing the pulsation modes (Córsico et al. 2016a; Istrate et al. 2016a).
The g-mode pulsation periods (Π) of WD stars experience a secular drift as they cool, giving place to a detectable rate of period change,  . Specifically, as the temperature in the core of a WD decreases, the plasma increases its degree of degeneracy so that the Brunt-Väisälä (buoyancy) frequency – the critical frequency of g-mode pulsations (Unno et al. 1989) – decreases, and the pulsational spectrum of the star is shifted to longer periods. On the other hand, gravitational contraction (if present) acts in the opposite direction, favoring the shortening of the pulsation periods. The competition between the increasing degeneracy and gravitational contraction gives rise to a detectable . In particular, it has been shown by Winget et al. (1983) that the rate of change of the g-mode pulsation periods is related to the rate of change of the temperature at the region of the period formation, Ṫ, and the rate of change of the stellar radius,
  , according to the following order-of-magnitude expression:
 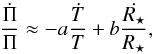 (1)where a and b are constants whose values depend on the details of the WD modeling (however a,b ≈ 1). The first term in Eq. (1) corresponds to the rate of change in period induced by the cooling of the WD, and since Ṫ< 0, it is a positive contribution. The second term represents the rate of change due to gravitational contraction (
 ), and it is a negative contribution.
In the cases in which robust measurements of secular period drifts of pulsating WDs can be achieved, a number of important applications can be – in principle – carried out (Mukadam et al. 2003). In particular, the derived values of could help in calibrating the WD cooling curves, thus reducing the theoretical uncertainties of WD cosmochronology to constrain the age of the Galactic disk (e.g., Harris et al. 2006), halo (e.g., Isern et al. 1998), and Galactic globular clusters (e.g., Hansen et al. 2013) and open clusters (García-Berro et al. 2010). The measurement of also could allow us to infer the chemical composition of the core of a WD (Kepler et al. 2005). This is because the rate of cooling of WDs, and so, the rate of period change of a given pulsation mode, depend primarily on the core composition and the stellar mass. At fixed mass, is larger for higher mean atomic weight of the core. This allows to place constraints on the core chemical composition. Another possible application of the measurement of is the detection of planets. The orbital motion of a pulsating WD around the center of mass of the system due to the possible presence of a planet modify the light travel time of the pulses. As a result, the observed arrival time on Earth changes, thus providing an alternative method to detect the planet (Mullally et al. 2008). Finally, the rates of period change in WDs allow, in principle, to place constraints on axions (Isern et al. 1992; Córsico et al. 2001, 2012a,b, 2016b; Bischoff-Kim et al. 2008; Battich et al. 2016), neutrinos (Winget et al. 2004; Córsico et al. 2014), and the possible secular rate of variation of the gravitational constant (Córsico et al. 2013). We note that, however, in order to establish robust constraints based on the rate of change of periods, it is necessary to know with some degree of accuracy the total mass, the effective temperature, the core composition, and the envelope layering of the target star (Fontaine & Brassard 2008).
The rate of change of the periods can be measured, in principle, by monitoring a pulsating WD over a long time interval when one or more very stable pulsation periods are present in their power spectrum. In the case of pulsating DA (H-rich atmosphere) and DB (He-rich atmosphere) WDs, also called DAV and DBV stars, respectively, cooling dominates over gravitational contraction, in such a way that the second term in Eq. (1) is usually negligible, and only positive values of the observed rate of change of period are expected (Winget & Kepler 2008; Fontaine & Brassard 2008; Althaus et al. 2010). For C/O-core DAVs, the expected rates of period change are in the range 10-15−10-16 s/s (Bradley et al. 1992; Bradley 1996), in excellent agreement with the measured values for G117−B15A ( s/s, Kepler 2012), R548 (
 s/s, Mukadam et al. 2013) and L19−2 (
 s/s, Sullivan & Chote 2015), although in strong conflict with the value derived for WD 0111+0018 (
 s/s, Hermes et al. 2013b). For DBVs, an estimate of the rate of period change has been obtained for PG 1351+489 (
 s/s, Redaelli et al. 2011), in line with the theoretical expectations (
 s/s; Winget et al. 2004; Córsico & Althaus 2004). In the case of pulsating hot WD and pre-WD stars, also called GW Vir or pulsating PG1159 stars (He-, C-, and O-rich atmosphere), theoretical models predict rates of period change in the range 10-11−10-12 s/s (Kawaler & Bradley 1994; Córsico & Althaus 2006; Córsico et al. 2008). For the high effective temperatures characterizing the GW Vir instability strip, gravitational contraction is still significant, to such a degree that its influence on can overcome the effects of cooling. In this case the second term in Eq. (1) is not negligible and, therefore, either positive or negative values of are possible. for several g modes has been measured in the case of the prototypical GW Vir star, PG1159−035 (Costa & Kepler 2008). The star exhibits a mixture of positive and negative values of large magnitude, up to ~4 × 10⁻¹⁰ s/s. In particular, the rate of period change of the mode with period Π = 517.1 s is
  s/s, an order of magnitude larger than the theoretical predictions (Kawaler & Bradley 1994; Córsico & Althaus 2006; Córsico et al. 2008). Althaus et al. (2008) have found that this discrepancy could be alleviated if PG1159−035 is characterized by a thin He-rich envelope, leading to remarkably large magnitudes of the rates of period change. A measurement of in another GW Vir star, PG0112+200, has been carried out by Vauclair et al. (2011). The derived rates of period change are much larger than those predicted by theoretical models (Córsico et al. 2007), calling for the presence of other mechanism(s) apart from neutrino cooling to explain the disagreement. In particular, a mechanism that could be playing a dominant role is resonant mode coupling induced by the rotation (Vauclair et al. 2011). A cautionary note regarding the interpretation of the measured rates of period change in pulsating WDs is needed here. The studies by Hermes et al. (2013b) for the DAV star WD 0111+0018, and Vauclair et al. (2011) for the GW Vir star PG0112+200 (among others), indicate that our understanding of the rates of period change in pulsating WDs is far from complete, and this should be kept in mind when using in the applications mentioned before.
In this paper, the fourth one of a series devoted to low-mass WD and pre-WD stars, we present for the first time a detailed assessment of the theoretical temporal rates of period change of ELMV and pre-ELMV stars. According to the theoretically estimated rates of cooling of these stars (Althaus et al. 2013), low-mass WDs cool slower than low-mass pre-WDs. On these grounds, it is expected that ELMVs will have smaller rates of period change than pre-ELMVs. Therefore, the eventual measurement of the rate of period change for a given pulsating star could be potentially useful to distinguish in which evolutionary stage the star is. Also, an eventual measurement of could help, in principle, to distinguish genuine ELM WDs (M⋆ ≲ 0.18−0.20 M⊙) that have thick H envelopes and long cooling timescales, from low-mass WDs (M⋆ ≳ 0.18−0.20 M⊙), characterized by thinner H envelopes and shorter cooling timescales. However, we must keep in mind that the cooling rates of this kind of stars could be so slow, that any secular period change would be very difficult to detect. Notwithstanding, some of these stars may not be on their terminal cooling tracks but rather may be on the pre-WD stage, or even going to a CNO flash, and thus have much higher (and much more easily measurable) values. In other words, the detection of any significant secular period change would be strong evidence for the object to be not on its final cooling track as an ELMV star. Although the measurement of for any of these stars is not expected shortly, it could be achieved in the next years by means of continuous photometric monitoring of these objects.
The paper is organized as follows. In Sect. 2 we briefly describe our numerical tools and the main ingredients of the evolutionary sequences we employ to assess the rates of period change of low-mass He-core WDs and pre-WDs. In Sect. 3 we present in detail our results of for ELMV and pre-ELMV models. In particular, we study the dependence of the rates of period change of nonradial dipole (ℓ = 1) g and p modes, and radial (ℓ = 0) modes with the stellar mass and the effective temperature. We expand the analysis by including the assessment of for stellar models evolving at stages previous of the development of thermonuclear CNO flashes during the early-cooling phase. Finally, in Sect. 4 we summarize the main findings of the paper.
2. Modeling
2.1. Evolutionary code
The fully evolutionary models of low-mass He-core WD and pre-WD stars on which this work is based were generated with the LPCODE stellar evolution code. LPCODE computes in detail the complete evolutionary stages leading to WD formation, allowing one to study the WD and pre-WD evolution in a consistent way with the expectations of the evolutionary history of progenitors. Details of LPCODE can be found in Althaus et al. (2005, 2009, 2013, 2015, 2017) and references therein. Here, we mention only those physical ingredients which are relevant for our analysis of low-mass, He-core WD and pre-WD stars (see Althaus et al. 2013, for details). The standard Mixing Length Theory (MLT) for convection in the version ML2 is used (Tassoul et al. 1990). The metallicity of the progenitor stars has been assumed to be Z = 0.01. Radiative opacities for arbitrary metallicity in the range from 0 to 0.1 are from the OPAL project (Iglesias & Rogers 1996). Conductive opacities are those of Cassisi et al. (2007). The equation of state during the main sequence evolution is that of OPAL for H- and He-rich compositions. Neutrino emission rates for pair, photo, and bremsstrahlung processes have been taken from Itoh et al. (1996), and for plasma processes we included the treatment of Haft et al. (1994). For the WD regime we have employed an updated version of the Magni & Mazzitelli (1979) equation of state. The nuclear network takes into account 16 elements and 34 thermonuclear reaction rates for pp-chains, CNO bi-cycle, He burning, and C ignition. Time-dependent element diffusion due to gravitational settling and chemical and thermal diffusion of nuclear species has been taken into account following the multicomponent gas treatment of Burgers (1969). Abundance changes have been computed according to element diffusion, nuclear reactions, and convective mixing. This detailed treatment of abundance changes by different processes during the WD regime constitutes a key aspect in the evaluation of the importance of residual nuclear burning for the cooling of low-mass WDs.
2.2. Pulsation code
The rates of period change of radial modes and nonradial p and g modes computed in this work were derived from the large set of adiabatic pulsation periods presented in Córsico & Althaus (2014a). These periods were computed employing the adiabatic radial and nonradial versions of the LP-PUL pulsation code described in detail in Córsico & Althaus (2006, 2014a), which is coupled to the LPCODE evolutionary code. The LP-PUL pulsation code is based on a general Newton-Raphson technique that solves the fourth-order (second-order) set of real equations and boundary conditions governing linear, adiabatic, nonradial (radial) stellar pulsations following the dimensionless formulation of Dziembowski (1971; see also Unno et al. 1989). The prescription we follow to assess the run of the Brunt-Väisälä frequency (N) is the so-called “Ledoux Modified” treatment (Tassoul et al. 1990; Brassard et al. 1991).
2.3. Evolutionary sequences
Realistic configurations for low-mass He-core WD and pre-WD stars were derived by Althaus et al. (2013) by mimicking the binary evolution of progenitor stars. Binary evolution was assumed to be fully nonconservative, and the loss of angular momentum due to mass loss, gravitational wave radiation, and magnetic braking was considered. All of the He-core pre-WD initial models were derived from evolutionary calculations for binary systems consisting of an evolving Main Sequence low-mass component (donor star) of initially 1 M⊙ and a 1.4 M⊙ neutron star companion as the other component. A total of 14 initial He-core pre-WD models with stellar masses between 0.1554 and 0.4352 M⊙ were computed for initial orbital periods at the beginning of the Roche lobe phase in the range 0.9 to 300 d. In this paper, we focus on the assessment of the rates of period change values corresponding to the complete evolutionary stages of these models down to the range of luminosities of cool WDs, including some stages previous to the thermonuclear CNO flashes during the beginning of the cooling branch.
3. The theoretical rates of period change
In this work, the rates of period change are assessed as simple differencing of the periods of successive models in each evolutionary sequence. Specifically, the rate of change of the period Πk at the time τi is estimated as: 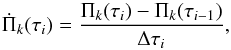 (2)where Δτi = τi−τi−1 is the evolutionary time step, and Πk(τi) and Πk(τi−1) are the pulsation periods of the mode with radial order k evaluated at the times τi and τi−1, respectively. In our computations, the time step Δτi is small enough as to ensure that this simple numerical recipe yields very precise results for . We compute the rate of period change for nonradial ℓ = 1,2g and p modes, and also radial (ℓ = 0) modes. The set of pulsation modes considered in this work covers a very wide range of periods (up to ~7000 s), embracing all the periodicities detected in ELMV and pre-ELMV stars up to now.
Low-mass WDs have real possibilities of being observed at three stages (Althaus et al. 2013): the final cooling branch (WD phase), the stages at constant luminosity following the end of Roche lobe overflow (pre-WD phase), and for M⋆ ≳ 0.18 M⊙, the evolutionary stages prior to the occurrence of CNO flashes on the early cooling branches (pre-flash stages)5. Below, we explore the magnitude and sign of the rates of period changes of low-mass WD stars at these evolutionary stages. In all the regimes considered in this work, the rate of period change values for ℓ = 2 are of the same order of magnitude than for ℓ = 1. Thus, we will concentrate on showing results only for the case ℓ = 1, although we must keep in mind that also modes with ℓ = 2 can be observed in these types of pulsating stars.
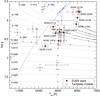 |
Fig. 1 Teff−log g plane showing the low-mass He-core WD evolutionary tracks (final cooling branches) of Althaus et al. (2013). Numbers correspond to the stellar mass of each sequence. The location of the ten known ELMVs (Hermes et al. 2012, 2013c,a; Kilic et al. 2015; Bell et al. 2015, 2016) are marked with large red circles (Teff and log g computed with 3D model atmospheres corrections). Stars observed not to vary (Steinfadt et al. 2012; Hermes et al. 2012, 2013c,a) are depicted with small black circles. The gray squares and triangles on the evolutionary tracks indicate the location of the template models analyzed in the text. The dashed blue line corresponds to the blue edge of the instability domain of ℓ = 1g modes according to the nonadiabatic computations of Córsico & Althaus (2016) using ML2 (α = 1.0) version of the MLT theory of convection. |
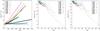 |
Fig. 2 Left: rates of period change of ℓ = 1g modes versus the pulsation periods, corresponding to WD models characterized by an effective temperature of Teff ~ 9000 K and different stellar masses (0.1554 ≤ M⋆/M⊙ ≤ 0.4352). Middle: same as in left panel, but for ℓ = 1p modes. Right: same as in left panel, but for radial (ℓ = 0) modes. |
3.1. WD phase: ELMVs
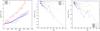 |
Fig. 3 Left: rates of period change of ℓ = 1g modes versus the pulsation periods, corresponding to WD models characterized by a stellar mass M⋆ = 0.1762 M⊙ and different effective temperatures. Middle: similar to left panel, but for ℓ = 1p modes. Right: similar to left panel, but for radial (ℓ = 0) modes. |
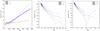 |
Fig. 4 Left: rates of period change of ℓ = 1g modes versus the pulsation periods, corresponding to WD models characterized by a stellar mass M⋆ = 0.1863 M⊙ and different effective temperatures. Middle: similar to the left panel, but for ℓ = 1p modes. Right: similar to the left panel, but for radial (ℓ = 0) modes. |
Next, we shall examine the effect of changing the stellar mass and the effective temperature on the rate of period change of ELMV models, that is, low-mass WD models already evolving in their final cooling branches. The adiabatic and nonadiabatic pulsation properties of pulsating low-mass WD stars, or ELMVs, have been explored in detail in Córsico et al. (2012c), Van Grootel et al. (2013), Córsico & Althaus (2014a, 2016). In Fig. 1 we present a Teff−log g diagram showing the low-mass He-core WD evolutionary tracks of Althaus et al. (2013), with the stellar masses indicated with small numbers. For illustrative purposes, we also include the location of the ten known ELMVs (Hermes et al. 2012, 2013c,a; Kilic et al. 2015; Bell et al. 2015, 2016) with red circles, and stars observed not to vary (Steinfadt et al. 2012; Hermes et al. 2012, 2013c,a), displayed with small black circles. The gray squares (triangles) on the evolutionary tracks indicate the location of the template models to be analyzed in Fig. 2 (Figs. 3 and 4) below.
In assessing the dependence of for g modes with M⋆ and Teff in WD stars, it is usual to consider the predictions of the simple cooling model of Mestel (1952) for comparison with numerical results. Within the framework of the Mestel’s cooling law, Kawaler et al. (1986) have derived a relation between and M⋆ and Teff (their Eq. (3)), which predicts that is larger for lower stellar masses and higher effective temperatures. The mass dependence can be understood by realizing that the lower the mass, the larger the radiating surface and the lower the total heat capacity. For a fixed Teff value, less massive models have higher luminosities and thus cool faster with a larger . Concerning the dependence of with the effective temperature, for a fixed M⋆, models with higher Teff cool faster, with the consequence that is larger. This simple picture becomes more complicated when there exist another energy source like nuclear burning, apart from the heat reservoir stored in the ions during the previous evolutionary phases. This is the case of low-mass WDs with M⋆ ≲ 0.18−0.20 M⊙ (ELM WDs), which are characterized by intense H burning. Thus, the simple predictions based on the Mestel theory cannot be applied to WDs in this mass range.
We depict in Fig. 2 the rates of period change in terms of periods for ℓ = 1g modes (left panel), ℓ = 1p modes (middle panel), and ℓ = 0 radial modes (right panel), for low-mass WD models with Teff ~ 9000 K and several stellar masses (0.1554 ≤ M⋆/M⊙ ≤ 0.4352). The location of these stellar models in the Teff−log g diagram is marked with gray squares in Fig. 1. For g modes (left panel of Fig. 2), linearly increases with the radial order k and thus with period, which is the reflection of the increase of Π with k. Two well distinguishable branches of the vs. Π relationship are visible in the figure, one of them corresponding to models with M⋆ ≳ 0.18 M⊙, and the other one associated to models with M⋆ ≲ 0.18 M⊙. In the first group of models, nuclear burning is not relevant, and so, the rate of period change is generally larger for lower stellar mass (at fixed Teff ~ 9000 K) and all the values are positive. We note that, for this set of models, g modes are very sensitive to the He/H composition gradient (see Fig. 8 of Córsico & Althaus 2014a). The fact that  implies that the rates of period change in models with M⋆ ≳ 0.18 M⊙ are dominated by cooling (first term in Eq. (1)). The rates of period change for this set of models range from ~10-15 s/s for the shortest g-mode periods6 up to ~7 × 10-14 s/s for Π ~ 6000 s.
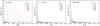 |
Fig. 5 Left: absolute value of the maximum rate of period change in terms of the stellar mass corresponding to ℓ = 1g modes with selected radial orders k, for WD models with effective temperatures in the range 8000 ≲ Teff ≲ 10 000 K. Middle: same as in the left panel, but for ℓ = 1p modes. Right: same as in the left panel, but for radial (ℓ = 0) modes. |
The absolute value of the upper limit of the theoretical rates of period change,  (in units of 10-15 s/s), for selected ℓ = 1g modes, corresponding to low-mass WD models with effective temperatures in the range 8000 ≲ Teff ≲ 10 000 K.
The values for the group of models with M⋆ ≲ 0.18 M⊙, on the other hand, are lower than ~10-14 s/s, and are indeed substantially smaller than for the first group of models. This is due to the fact that, for models with stellar masses lower than the threshold mass of ~0.18 M⊙, the evolution is dominated by nuclear burning. As a result, the WD cooling is markedly delayed, in such a way that the rates of period change are smaller in magnitude as compared with the case in which nuclear burning is negligible (M⋆ ≳ 0.18 M⊙). We note that g modes in this mass range mainly probe the core regions (see Fig. 7 of Córsico & Althaus 2014a). The values for models M⋆ ≲ 0.18 M⊙ are smaller for lower stellar mass, as it can be seen in left panel of Fig. 2. This trend is opposite to that predicted by the simple formula of Kawaler et al. (1986; see above). The fact that in this mass range (0.15 ≲ M⋆/M⊙ ≲ 0.18) the lowest-mass models are characterized by smaller values is due to that these models have more intense nuclear burning, which implies smaller cooling timescales. In this context, it is expected that the first term in Eq. (1) (cooling) for these sequences must be small, and the second term in this equation (gravitational contraction) must be large, as compared with the case of the most massive WD sequences (M⋆ ≳ 0.18 M⊙). This is precisely what we found by examining the evolution of the stellar radius in our evolutionary sequences. Interestingly enough, for the lowest-mass model (M⋆ = 0.1554 M⊙), most of the values are negative. This means that the pulsation periods of g modes for this model generally shorten while the WD cools down. This novel result can be understood by realising that, for this WD sequence, the gravitational contraction is so large that the term in  of Eq. (1) overcomes the term in Ṫ/T and so, the rates of period change are negative.
We now examine the trend of the rates of period change with the pulsation periods for p modes and radial modes, corresponding to the same template models at Teff ~ 9000 K. According to the results of Córsico & Althaus (2014a), p- and radial-mode periods decrease with decreasing Teff (see their Fig. 19). Therefore, we expect the values for these kinds of modes to be all negative. This expectation is borne out by examining the middle and right panels of Fig. 2. In the case of p modes, this behavior is due to the fact that the Lamb frequency – which is the critical frequency of nonradial p modes – increases for decreasing effective temperatures (Córsico & Althaus 2014a), in such a way that the whole p-mode frequency spectrum shifts to higher frequencies, and so to shorter periods, as the WD cools. Radial modes exhibit the same behavior as p modes. Regarding the dependence of with the stellar mass, according to our numerical results, the magnitude of the rates of period change is larger for lower M⋆, as shown in Fig. 2. We note that, in this case, there is no obvious difference in the behavior of between models with intense nuclear burning (M⋆ ≲ 0.18 M⊙) or models characterized by negligible nuclear burning (M⋆ ≳ 0.18 M⊙). All in all, the magnitudes of the rates of period change are smaller than ~1.6 × 10⁻¹⁵ s/s for the range of radial- and p-mode periods analyzed. These values are an order of magnitude smaller than for g modes, and then, they would be very difficult (if not impossible) to measure in the eventual case in which radial modes and/or nonradial p modes were detected in low-mass WDs. It is worth noting that Hermes et al. (2013c) have found short periods (~100−140 s) in the light curve of the ELMV star SDSS J111215.82+111745.0 that could be associated to p modes (or even radial modes), but these observations need confirmation.
In the left panels of Figs. 3 and 4 we display the rate of period change of ℓ = 1g modes versus the pulsation periods, corresponding to template WD models characterized by stellar masses M⋆ = 0.1762 M⊙ and M⋆ = 0.1863 M⊙, respectively, and different effective temperatures. Middle and right panels of the same figures correspond to p- and radial-mode periods, respectively. The location of these template models in the Teff−log g plane is indicated with gray triangle symbols on the pertinent evolutionary tracks of Fig. 1. We first focus on the results for g modes of the 0.1762 M⊙ sequence at Teff ~ 10 100 K, 9100 K, 8100 K and 7400 K (left panel of Fig. 3). Unlike what might be expected, the values do not vary monotonously with the effective temperature, at least for long periods (≳1500 s). Indeed, first decreases from Teff ~ 10 100 K to Teff ~ 9100 K, and then increases for lower Teff. The rates of period change are all positive for the complete range of effective temperatures considered, except in the case of the k = 1g mode, which exhibit  for the hottest template models. For this sequence of models and for the complete range of Teff, we found
  s/s. For p and radial modes, the rates of period change are all negative, and their absolute values are below
  s/s (middle and right panel of Fig. 3). Similar to what happens for g modes, for radial and p modes the magnitude of the rates of period change do not monotonously change with Teff, although on average,
  decreases with decreasing effective temperature.
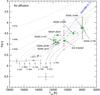 |
Fig. 6 Teff−log g diagram showing our low-mass He-core pre-WD evolutionary tracks (thin dotted black lines) computed neglecting element diffusion. Numbers correspond to the stellar mass of each sequence. Green circles with error bars correspond to the known pre-ELMV stars (Maxted et al. 2013, 2014; Corti et al. 2016; Gianninas et al. 2016; Zhang et al. 2016), and small black circles depict the location of pre-ELM (nonvariable) WDs observed in the Kepler mission field (Rappaport et al. 2015; van Kerkwijk et al. 2010; Carter et al. 2011; Breton et al. 2012). The dashed blue line indicates the nonradial dipole (ℓ = 1) blue edge of the pre-ELMV instability domain due to the κ−γ mechanism acting at the He+ −He++ partial ionization region, as obtained in Córsico et al. (2016a). The gray squares and triangles on the evolutionary tracks indicate the location of the template models analyzed in the text. |
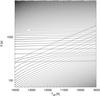 |
Fig. 7 Evolution of the pulsation periods of p, g, and p−g mixed modes with ℓ = 1 from low to high Teff values for pre-WD models with M⋆ = 0.1763 M⊙. We note the multiple avoided crossings experienced for the modes with periods in the range 250−2000 s. |
The behavior of vs. Π found for models with M⋆ = 0.1863 M⊙ (Fig. 4) is qualitatively similar to that described for the models with M⋆ = 0.1762 M⊙. The only relevant difference is that the magnitude of the rate of period change for g modes (left panel) is notoriously greater than for M⋆ = 0.1762 M⊙. This is expected because, as stated before in this paper and in the previous papers of this series, models with M⋆ ≳ 0.18 M⊙ do not experience appreciable nuclear burning and evolve much faster than models with M⋆ ≲ 0.18 M⊙. On the other hand, the values of p and radial modes for the models with M⋆ = 0.1863 M⊙ are smaller (about a half) than those corresponding to models with M⋆ = 0.1762 M⊙. According to our results for M⋆ = 0.1863 M⊙,  s/s for g modes, and
  s/s for p and radial modes (Fig. 4) in the range of periods considered (Π ≲ 6000 s).
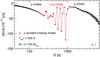 |
Fig. 8
|
We close this section by considering the absolute value of the maximum rate of period change that is theoretically expected in pulsating low-mass He-core WDs (ELMVs) for the complete interval of effective temperature and mass range considered in this work. We display in Fig. 5 the  values in terms of M⋆ for ℓ = 1g modes (left panel), p modes (middle panel) and radial modes (right panel) for selected values of the radial order k, covering the range of periods observed in ELMV stars. In the case of g modes, there is a clear distinction in the magnitude of depending on whether M⋆ ≳ 0.18 M⊙ or M⋆ ≲ 0.18 M⊙. Indeed, we expect to measure much larger values of (up to 8 × 10-14 s/s) for WD stars with masses larger than ~0.18 M⊙ than for stars with M⋆ ≲ 0.18 M⊙ (
 s/s at most). We show in Table 1 the maximum absolute values of the rates of period change for g modes for selected values of the radial order k corresponding to each stellar mass considered in this work (left panel of Fig. 5). In the case of p and radial modes (middle and right panels of Fig. 5), our models predict magnitudes of the rates of period changes much smaller, up to ~8 × 10-15 s/s, corresponding to the lowest-order modes and the lowest-mass WDs (M⋆ ~ 0.15 M⊙). We note that this range of is similar to that of the g modes for M⋆ ≲ 0.18 M⊙, although for p and radial modes it is expected that for all the modes.
3.2. Pre-WD phase: pre-ELMVs
Here, we concentrate on the theoretical rates of period change for stellar models at evolutionary stages previous to the WD stage, that is, before the stars reach their maximum effective temperature at the beginning of the first cooling branch. As described in Althaus et al. (2013), models with masses higher than ~0.18 M⊙ experience multiple CNO flashes after this pre-WD stage and before enter their final cooling tracks. The nonadiabatic properties of pulsating low-mass pre-WD stars, or pre-ELMVs, have been explored at length in Córsico et al. (2016a), Gianninas et al. (2016), Istrate et al. (2016a). In Fig. 6 we present a Teff−log g diagram showing our low-mass He-core pre-WD evolutionary tracks (thin dotted black curves) without element diffusion. We have chosen to explore the case in which element diffusion is not allowed to operate, due to that recent nonadiabatic studies indicate that element diffusion must be weakened so that pulsations can be excited by the κ mechanism acting at the zone of the second partial ionization of He (Córsico et al. 2016a; Istrate et al. 2016a). Exploratory computations in which element diffusion is considered do not show substantial differences regarding the values reported in this work. In Fig. 6, the stellar mass of each sequence is indicated with a small number. For illustrative purposes, we show the location of the known pre-ELMVs (Maxted et al. 2013, 2014; Corti et al. 2016; Gianninas et al. 2016; Zhang et al. 2016), and the stars observed not to vary (small black circles). The gray squares and triangles indicate the location of the template models to be analyzed below.
The Brunt-Väisälä frequency in the inner regions of our low-mass pre-WD models adopts very high values (see Figs. 2 and 3 of Córsico et al. 2016a). As a consequence, for these models there is a considerable range of intermediate frequencies for which the modes behave like g modes in the inner parts of the star and like p modes in the outer parts. A similar situation is found in H-deficient pre-WD models representative of GW Vir stars before the evolutionary knee (Córsico & Althaus 2006). These intermediate-frequency modes, which are called “p−g mixed modes” (Scuflaire 1974; Osaki 1975; Aizenman et al. 1977), are characterized by pulsation periods between the short periods of pure p modes and the longer periods of g modes. Mixed modes and the associated phenomena of “avoided crossing”, in which the periods approach each other quite closely without actually crossing (Aizenman et al. 1977; Christensen-Dalsgaard 1981), have been extensively investigated in the context of sub-giants and red giant pulsating stars (see, e.g., Christensen-Dalsgaard & Houdek 2010; Deheuvels & Michel 2010). In Fig. 7 we show the pulsation periods of nonradial p, g, and p−g mixed modes with ℓ = 1 as a function of Teff for He-core pre-WD models with M⋆ = 0.1763 M⊙. The time evolution proceeds from low to high effective temperatures, that is, from right to left in the plot. We note that all the pulsation periods decrease with increasing Teff, so the rates of period change are negative for all the pulsation modes. According to Eq. (1), the second term must dominate over the first one in order to . This reflects the fact that the models are contracting as they evolve toward higher effective temperatures (see Fig. 6). The existence of multiples avoided crossings is evident from Fig. 77. The main effect of avoided crossing is that during the approximation of the periods, they strongly change in magnitude, so we would expect to show pronounced changes during an avoided crossing. We display in Fig. 8 the rates of period change as a function of periods of ℓ = 1 modes for a 0.1763 M⊙ pre-WD model at Teff = 11 000 K. The modes involved in avoided crossings are emphasized with red dots. Clearly, some p−g mixed modes that take part of avoided crossings exhibit larger values (in modulus) than pure g and p modes that do not participate in avoided crossings.
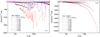 |
Fig. 9 Left: rates of period change versus the pulsation periods of ℓ = 1g, p, and p−g mixed modes, corresponding to low-mass pre-WD models characterized by an effective temperature of Teff ~ 10 500 K and different stellar masses (0.1554 ≤ M⋆/M⊙ ≤ 0.2390). Right: same as in left panel, but for radial (ℓ = 0) modes. |
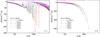 |
Fig. 10 Left: rates of period change versus the pulsation periods of ℓ = 1g, p, and p−g mixed modes, corresponding to low-mass pre-WD models characterized by a stellar mass M⋆ = 0.1703 M⊙ and different effective temperatures. Right: similar to left panel, but for radial (ℓ = 0) modes. |
We now briefly explore the dependence of the values of our low-mass pre-WD models with the stellar mass and the effective temperature. As we mentioned, for all of our pre-WD models, the complete set of radial and nonradial pulsation modes considered is characterized by negative values of the rates of period change. In Fig. 9 we depict the rates of period change as a function of the pulsation periods of ℓ = 1g, p, and p−g mixed modes (left panel), corresponding to low-mass pre-WD models with Teff ~ 10 500 K and 0.1554 ≤ M⋆/M⊙ ≤ 0.2390). The right panel shows the results for radial modes. Our computations indicate that the magnitude of the rates of period change is larger for higher stellar masses. Specifically, is as large as ~1.75 × 10⁻¹² s/s for the model with M⋆ = 0.2390 M⊙. In comparison with the maximum values of predicted for ELMV stars (Fig. 5 and Table 1), the magnitude of the rates of period change for nonradial modes in the case of pre-ELMV stars is roughly 20 times larger. In the case of radial modes, on the other hand, the rates of period change for pre-ELMVs (right panel of Fig. 9) are about 3−4 orders of magnitude larger than for ELMVs (right panel of Fig. 5).
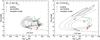 |
Fig. 11 Left: evolutionary track of the 0.1821 M⊙ sequence in the log Teff−log g diagram. Red (green) circles mark the location of the known ELMV (pre-ELMV) stars. The gray square corresponds to a template model located shortly before the last CNO flash occurs. The arrows on the track indicate the sense of time evolution. Right: same as in left panel, but for the 0.2724 M⊙ sequence. |
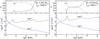 |
Fig. 12 Left: internal chemical abundances of H and He (upper panel) and the logarithm of the squared Brunt-Väisälä and Lamb frequencies (lower panel) in terms of the mass coordinate [−log (1−Mr/M⋆)] corresponding to the pre-CNO flash template model with M⋆ = 0.1821 M⊙ and Teff = 13 446 K whose location in the log Teff−log g diagram is indicated in the left panel of Fig. 11. Right: same as in left panel, but for the pre-CNO flash template model with 0.2724 M⊙ and Teff = 16 481 K. Its location in the log Teff−log g plane plane is indicated in the right panel of Fig. 11. |
In Fig. 10 we show the values in terms of Π of ℓ = 1g, p, and p−g mixed modes (left panel), corresponding to low-mass pre-WD models characterized by a stellar mass M⋆ = 0.1703 M⊙ and different values of the effective temperature (8000 ≲ Teff ≲ 14 000 K). The right panel corresponds to radial modes. The magnitude of the rates of period change for nonradial modes is larger for lower effective temperatures. Interestingly enough, the reverse situation is found in the case of radial modes.
We conclude this section by noting that, in general, the rates of change of periods (both of radial and nonradial modes) expected for pre-ELMV stars are considerably larger (≈1000–10 000 times) than for ELMV stars. In practise, this indicates that it would be more likely to achieve the measurement of for pre-ELMVs than for ELMVs.
3.3. Pre-CNO flash stages (M⋆≳ 0.18 M⊙)
Having explored in detail the theoretically expected properties of for the ELMV and pre-ELMV pulsating stars, here we focus on the expected rates of period change for stellar models at stages previous to the CNO flashes on the early cooling branches (pre-flash stages). As it is shown in Althaus et al. (2013; see their Fig. 4), the stages previous to the occurrence of CNO flashes are characterized by a relatively slow evolution, implying that there are chances to observe a star going through that evolutionary phases. Put in numbers, the time spent by the star to evolve between the maximum Teff and the end of the last CNO flash in the case of the 0.1821 M⊙ sequence (that is, the coloured portion of the track in the lower panel of Fig. 4 of Althaus et al. 2013) is of about 8 × 10⁷ yr. We emphasize that no pulsating low-mass WD star is known until now that, according to its Teff and log g values, could be associated with a pre-CNO flash stage. Even so, we believe that it is worth exploring what the upper limit of the rates of period change for a star in that evolutionary stage should be. In the computations of Althaus et al. (2013), only model sequences with masses in the range 0.186−0.362 M⊙ experience CNO flashes. So, we restrict our analysis to models in that range of masses. In Fig. 11 we show the evolutionary tracks for the sequence with 0.1821 M⊙ (left) and 0.2724 M⊙ (right) in the log Teff−log g diagram. The gray squares correspond to representative models located shortly before the last CNO flash for these sequences occurs. The chemical profiles and the propagation diagram (the run of the logarithm of the Brunt-Väisälä and Lamb frequencies in terms of the mass coordinate) for these template models are displayed in Fig. 12. At variance with the case of stellar models located at the stage of the pre-ELMVs (Sect. 3.2) in this case the propagation regions of p and g modes are well delimited, so that there are no p−g mixed modes, but only pure p and g modes.
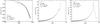 |
Fig. 13 Left: rates of period change (in units of 10-15 s/s) of ℓ = 1g modes corresponding to the pre-CNO flash template model with M⋆ = 0.1821 M⊙ and Teff = 13 446 K (see the left panels of Fig. 12). Middle: same as in left panel, but for ℓ = 1p modes. Right: same as in left panel, but for radial (ℓ = 0) modes. |
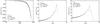 |
Fig. 14 Left: rate of period change (in units of 10-15 s/s) of ℓ = 1g modes corresponding to the pre-CNO flash template model with M⋆ = 0.2724 M⊙ and Teff = 16 481 K (see the right panels of Fig. 12). Middle: same as in left panel, but for ℓ = 1p modes. Right: same as in left panel, but for radial (ℓ = 0) modes. |
Figures 13 and 14 depict the rates of period change in terms of periods corresponding to the template models with (M⋆ = 0.1821M⊙,Teff = 13 446 K) and (M⋆ = 0.2724 M⊙,Teff = 16 481 K), respectively. Left panels show the results for g modes, while middle and right panels display the results for p and radial modes, respectively. The values for g modes are all negative, while for p and radial modes they are all positive. For the three kinds of modes, the magnitude of increases for increasing radial orders. Interestingly enough, the magnitude of for g modes is by far larger than for p and radial modes. In particular, for the range of periods considered in this work (Π ≲ 7000 s), we obtain  s/s for g modes in the case of the 0.1821 M⊙ model, and
  s/s for the 0.2724 M⊙ model. In contrast, in the case of p and radial modes, adopts values of ~2 × 10-13 s/s at most.
The absolute value of the maximum expected rates of period change, (s/s), and the sign, for nonradial ℓ = 1g and p modes (and p−g mixed modes in the case of pre-ELMVs), and for radial (ℓ = 0) modes corresponding to low-mass WD and pre-WD models and also objects evolving just before the CNO flashes.
We conclude that, if a pulsating star was evolving in stages prior to a CNO flash, the measured rate of period change (if it could be measured) would be of the order of 10-10−10-11 s/s at most. On the other hand, if the detected rate of period change was greater than those values, the object would be evolving extremely fast through any of the loops among flashes that are observed in Fig. 11 (see also Fig. 2 of Althaus et al. 2013). However, in that case the evolution would be extremely fast, and therefore the probability of catching such a star in that evolutionary stage should be very low.
4. Summary and conclusions
In this paper, the fourth one of a series devoted to low-mass WD and pre-WD stars, we presented for the first time a detailed assessment of the theoretical temporal rates of period change of ELMV and pre-ELMV pulsating stars. Specifically, we have computed the rates of period change for dipole (ℓ = 1) nonradial g and p modes and also for radial (ℓ = 0) modes. We have considered periods up to ~7000 s, thus covering the period range detected in the known pulsating low-mass WD stars. We have considered evolutionary stages at the final cooling branches (WD phase), evolutionary phases prior to the occurrence of CNO flashes on the early cooling branches (pre-flash stages), and the stages at constant luminosity following the end of Roche lobe overflow (pre-WD phase). The study is based on the modern and physically sound evolutionary models of low-mass He-core WDs of Althaus et al. (2013).
In Table 2 we summarize our findings regarding the maximum8 (in absolute value) that we would expect for the different kinds of modes (nonradial g and p modes, and radial modes) for stars in the distinct evolutionary stages considered. We also include the sign of the rate of period change in each case. We found that, in general, the theoretically expected magnitude of the rates of period change of pure g modes for pre-ELMVs (~3 × 10-13) are larger than for ELMVs (~8 × 10-14). We note that, for pre-ELMVs, the largest rates of period change (~5 × 10-12) are associated to p−g mixed modes involved in avoided crossings. In turn, the values of g modes for models evolving shortly before the occurrence of CNO flashes (~3 × 10-11) are by far larger than the maximum rates of period change predicted for pure g modes in pre-ELMV stars. If we focus on the ELMV models, we find that the rates of period change for M⋆ ≲ 0.18 M⊙ are ten times smaller than for more massive models. In the case of p modes and radial modes, we found that the larger absolute values correspond to pre-ELMV models, followed by the associated to the pre-CNO flash phases. The smallest values of for these kinds of modes correspond to ELMV models.
Based on the theoretically predicted values of presented in this work, we conclude that any future measurement of a rate of period change for a given pulsating low-mass pre-WD or WD star could shed light about its evolutionary status. In particular, it could be possible to distinguish a star that is in its pre-WD phase, if it is evolving in stages just prior to a H flash, or if it is already settled on its final cooling stage as a WD. Eventually, it would also be possible (although less likely) to distinguish whether or not a star is in its final cooling branch has a extremely low mass (M⋆ ≲ 0.18 M⊙). Finally, a measured value of larger than ~10-10 s/s would imply that the star is still evolving rapidly between the CNO flashes.
We close the paper by noting that the recent results of Bell et al. (2016) cast some doubts on the ELMV classification of several stars in the ELM Survey, apart from just SDSS J135512+195645. These authors find an overabundance of pulsating stars with ELM-like spectra at Teff ≲ 9000 K that lack radial-velocity variations, and so, it cannot be confirmed that they are in binary systems, as we would expect on the grounds of the currently accepted evolutionary channels for these stars. Therefore, in view of the systematic difficulties in the spectroscopic classification, an eventual measurement of could help to confirm that a given pulsating star is a genuine ELM WD.
The star SDSS J135512+195645 discovered by Bell et al. (2016) is likely a high-amplitude δ Scuti pulsator with an overestimated surface gravity, as pointed by these authors.
For simplicity, here and throughout the paper we refer to the pulsating low-mass WDs as ELMVs, even if M⋆ ≳ 0.18−0.20 M⊙.
The nature of the variable stars reported by Corti et al. (2016) is unclear, as they could be precursors of low-mass WD stars or, alternatively, δ Scuti/SX Phe-like stars, as pointed by these authors.
Here and throughout the paper we refer to the pulsating low-mass pre-WDs as pre-ELMVs, even if M⋆ ≳ 0.18−0.20M⊙.
During the rapid incursions of the stars in the log Teff−log g diagram, while they are looping between the CNO flashes, the evolution is so fast that the probability of finding a star in those stages is almost null (Althaus et al. 2013). For this reason, we will not consider those evolutionary stages in this work.
We note that the value for some low-order modes is very close to zero, or even negative.
In the case of radial modes, which is not shown, no avoided crossings are found.
That is, considering the maximum possible values not only for the specific models analyzed in previous sections, but globally for stellar models with all the masses and effective temperatures considered in this work.
Acknowledgments
We wish to thank our anonymous referee for his/her constructive comments and suggestions that improved the original version of the paper. We also thanks Keaton Bell and J.J. Hermes for the exchange of emails with valuable comments that enriched the content of this study. Part of this work was supported by AGENCIA through the Programa de Modernización Tecnológica BID 1728/OC-AR, and by the PIP 112-200801-00940 grant from CONICET. This research has made use of NASA Astrophysics Data System.
References
- Aizenman, M., Smeyers, P., & Weigert, A. 1977, A&A, 58, 41 [NASA ADS] [Google Scholar]
- Althaus, L. G., Serenelli, A. M., & Benvenuto, O. G. 2001, MNRAS, 323, 471 [NASA ADS] [CrossRef] [Google Scholar]
- Althaus, L. G., Serenelli, A. M., Panei, J. A., et al. 2005, A&A, 435, 631 [NASA ADS] [CrossRef] [EDP Sciences] [Google Scholar]
- Althaus, L. G., Córsico, A. H., Miller Bertolami, M. M., García-Berro, E., & Kepler, S. O. 2008, ApJ, 677, L35 [NASA ADS] [CrossRef] [Google Scholar]
- Althaus, L. G., Panei, J. A., Romero, A. D., et al. 2009, A&A, 502, 207 [NASA ADS] [CrossRef] [EDP Sciences] [Google Scholar]
- Althaus, L. G., Córsico, A. H., Isern, J., & García-Berro, E. 2010, A&ARv, 18, 471 [NASA ADS] [CrossRef] [Google Scholar]
- Althaus, L. G., Miller Bertolami, M. M., & Córsico, A. H. 2013, A&A, 557, A19 [NASA ADS] [CrossRef] [EDP Sciences] [Google Scholar]
- Althaus, L. G., Camisassa, M. E., Miller Bertolami, M. M., Córsico, A. H., & García-Berro, E. 2015, A&A, 576, A9 [NASA ADS] [CrossRef] [EDP Sciences] [Google Scholar]
- Althaus, L. G., De Gerónimo, F. C., Córsico, A. H., Torres, S., & García–Berro, E. 2017, A&A, 597, A67 [NASA ADS] [CrossRef] [EDP Sciences] [Google Scholar]
- Bassa, C. G., van Kerkwijk, M. H., & Kulkarni, S. R. 2003, A&A, 403, 1067 [NASA ADS] [CrossRef] [EDP Sciences] [Google Scholar]
- Battich, T., Córsico, A. H., Althaus, L. G., & Miller Bertolami, M. M. 2016, Cosmol. Astropart. Phys., 8, 062 [Google Scholar]
- Bell, K. J., Kepler, S. O., Montgomery, M. H., et al. 2015, in 19th European Workshop on White Dwarfs, eds. P. Dufour, P. Bergeron, & G. Fontaine, ASP Conf. Ser., 493, 217 [Google Scholar]
- Bell, K. J., Gianninas, A., Hermes, J. J., et al. 2016, ApJ, ApJ, 835, 180 [Google Scholar]
- Bischoff-Kim, A., Montgomery, M. H., & Winget, D. E. 2008, ApJ, 675, 1512 [NASA ADS] [CrossRef] [Google Scholar]
- Bradley, P. A. 1996, ApJ, 468, 350 [NASA ADS] [CrossRef] [Google Scholar]
- Bradley, P. A., Winget, D. E., & Wood, M. A. 1992, ApJ, 391, L33 [NASA ADS] [CrossRef] [Google Scholar]
- Brassard, P., Fontaine, G., Wesemael, F., Kawaler, S. D., & Tassoul, M. 1991, ApJ, 367, 601 [NASA ADS] [CrossRef] [Google Scholar]
- Breton, R. P., Rappaport, S. A., van Kerkwijk, M. H., & Carter, J. A. 2012, ApJ, 748, 115 [NASA ADS] [CrossRef] [Google Scholar]
- Brickhill, A. J. 1991, MNRAS, 251, 673 [NASA ADS] [Google Scholar]
- Brown, W. R., Kilic, M., Allen de Prieto, C., & Kenyon, S. J. 2010, ApJ, 723, 1072 [NASA ADS] [CrossRef] [Google Scholar]
- Brown, W. R., Kilic, M., Allen de Prieto, C., & Kenyon, S. J. 2012, ApJ, 744, 142 [NASA ADS] [CrossRef] [Google Scholar]
- Brown, W. R., Kilic, M., Allen de Prieto, C., Gianninas, A., & Kenyon, S. J. 2013, ApJ, 769, 66 [NASA ADS] [CrossRef] [Google Scholar]
- Brown, W. R., Gianninas, A., Kilic, M., Kenyon, S. J., & Allen de Prieto, C. 2016a, ApJ, 818, 155 [NASA ADS] [CrossRef] [Google Scholar]
- Brown, W. R., Kilic, M., Kenyon, S. J., & Gianninas, A. 2016b, ApJ, 824, 46 [NASA ADS] [CrossRef] [Google Scholar]
- Burgers, J. M. 1969, Flow Equations for Composite Gases (New York: Academic Press) [Google Scholar]
- Carter, J. A., Rappaport, S., & Fabrycky, D. 2011, ApJ, 728, 139 [NASA ADS] [CrossRef] [Google Scholar]
- Cassisi, S., Potekhin, A. Y., Pietrinferni, A., Catelan, M., & Salaris, M. 2007, ApJ, 661, 1094 [NASA ADS] [CrossRef] [Google Scholar]
- Christensen-Dalsgaard, J. 1981, MNRAS, 194, 229 [NASA ADS] [Google Scholar]
- Christensen-Dalsgaard, J., & Houdek, G. 2010, Ap&SS, 328, 51 [NASA ADS] [CrossRef] [Google Scholar]
- Córsico, A. H., & Althaus, L. G. 2004, A&A, 428, 159 [NASA ADS] [CrossRef] [EDP Sciences] [Google Scholar]
- Córsico, A. H., & Althaus, L. G. 2006, A&A, 454, 863 [NASA ADS] [CrossRef] [EDP Sciences] [Google Scholar]
- Córsico, A. H., & Althaus, L. G. 2014a, A&A, 569, A106 [NASA ADS] [CrossRef] [EDP Sciences] [Google Scholar]
- Córsico, A. H., & Althaus, L. G. 2014b, ApJ, 793, L17 [NASA ADS] [CrossRef] [Google Scholar]
- Córsico, A. H., & Althaus, L. G. 2016, A&A, 585, A1 [NASA ADS] [CrossRef] [EDP Sciences] [Google Scholar]
- Córsico, A. H., Benvenuto, O. G., Althaus, L. G., Isern, J., & García-Berro, E. 2001, New Astron., 6, 197 [NASA ADS] [CrossRef] [Google Scholar]
- Córsico, A. H., Miller Bertolami, M. M., Althaus, L. G., Vauclair, G., & Werner, K. 2007, A&A, 475, 619 [NASA ADS] [CrossRef] [EDP Sciences] [Google Scholar]
- Córsico, A. H., Althaus, L. G., Kepler, S. O., Costa, J. E. S., & Miller Bertolami, M. M. 2008, A&A, 478, 869 [NASA ADS] [CrossRef] [EDP Sciences] [Google Scholar]
- Córsico, A. H., Althaus, L. G., Miller Bertolami, M. M., et al. 2012a, MNRAS, 424, 2792 [NASA ADS] [CrossRef] [Google Scholar]
- Córsico, A. H., Althaus, L. G., Romero, A. D., et al. 2012b, Cosmol. Astropart. Phys., 12, 10 [Google Scholar]
- Córsico, A. H., Romero, A. D., Althaus, L. G., & Hermes, J. J. 2012c, A&A, 547, A96 [NASA ADS] [CrossRef] [EDP Sciences] [Google Scholar]
- Córsico, A. H., Althaus, L. G., García-Berro, E., & Romero, A. D. 2013, Cosmol. Astropart. Phys., 6, 032 [NASA ADS] [CrossRef] [Google Scholar]
- Córsico, A. H., Althaus, L. G., Miller Bertolami, M. M., Kepler, S. O., & García-Berro, E. 2014, Cosmol. Astropart. Phys., 8, 054 [Google Scholar]
- Córsico, A. H., Althaus, L. G., Serenelli, A. M., et al. 2016a, A&A, 588, A74 [NASA ADS] [CrossRef] [EDP Sciences] [Google Scholar]
- Córsico, A. H., Romero, A. D., Althaus, L. G., et al. 2016b, Cosmol. Astropart. Phys., 7, 036 [Google Scholar]
- Corti, M. A., Kanaan, A., Córsico, A. H., et al. 2016, A&A, 587, L5 [NASA ADS] [CrossRef] [EDP Sciences] [Google Scholar]
- Costa, J. E. S., & Kepler, S. O. 2008, A&A, 489, 1225 [NASA ADS] [CrossRef] [EDP Sciences] [Google Scholar]
- Deheuvels, S., & Michel, E. 2010, Ap&SS, 328, 259 [NASA ADS] [CrossRef] [Google Scholar]
- Dziembowski, W. A. 1971, Acta Astron., 21, 289 [NASA ADS] [Google Scholar]
- Fontaine, G., & Brassard, P. 2008, PASP, 120, 1043 [NASA ADS] [CrossRef] [Google Scholar]
- García-Berro, E., Torres, S., Althaus, L. G., et al. 2010, Nature, 465, 194 [NASA ADS] [CrossRef] [PubMed] [Google Scholar]
- Gianninas, A., Dufour, P., Kilic, M., et al. 2014, ApJ, 794, 35 [NASA ADS] [CrossRef] [Google Scholar]
- Gianninas, A., Kilic, M., Brown, W. R., Canton, P., & Kenyon, S. J. 2015, ApJ, 812, 167 [NASA ADS] [CrossRef] [Google Scholar]
- Gianninas, A., Curd, B., Fontaine, G., Brown, W. R., & Kilic, M. 2016, ApJ, 822, L27 [NASA ADS] [CrossRef] [Google Scholar]
- Haft, M., Raffelt, G., & Weiss, A. 1994, ApJ, 425, 222 [NASA ADS] [CrossRef] [Google Scholar]
- Hansen, B. M. S., Kalirai, J. S., Anderson, J., et al. 2013, Nature, 500, 51 [NASA ADS] [CrossRef] [Google Scholar]
- Harris, H. C., Munn, J. A., Kilic, M., et al. 2006, AJ, 131, 571 [NASA ADS] [CrossRef] [Google Scholar]
- Hermes, J. J., Montgomery, M. H., Winget, D. E., et al. 2012, ApJ, 750, L28 [Google Scholar]
- Hermes, J. J., Montgomery, M. H., Gianninas, A., et al. 2013a, MNRAS, 436, 3573 [NASA ADS] [CrossRef] [Google Scholar]
- Hermes, J. J., Montgomery, M. H., Mullally, F., Winget, D. E., & Bischoff-Kim, A. 2013b, ApJ, 766, 42 [NASA ADS] [CrossRef] [Google Scholar]
- Hermes, J. J., Montgomery, M. H., Winget, D. E., et al. 2013c, ApJ, 765, 102 [Google Scholar]
- Iglesias, C. A., & Rogers, F. J. 1996, ApJ, 464, 943 [NASA ADS] [CrossRef] [Google Scholar]
- Isern, J., Hernanz, M., & García-Berro, E. 1992, ApJ, 392, L23 [NASA ADS] [CrossRef] [Google Scholar]
- Isern, J., García-Berro, E., Hernanz, M., Mochkovitch, R., & Torres, S. 1998, ApJ, 503, 239 [NASA ADS] [CrossRef] [Google Scholar]
- Istrate, A. G., Fontaine, G., Gianninas, A., et al. 2016a, A&A, 595, L12 [NASA ADS] [CrossRef] [EDP Sciences] [Google Scholar]
- Istrate, A. G., Marchant, P., Tauris, T. M., et al. 2016b, A&A, 595, A35 [NASA ADS] [CrossRef] [EDP Sciences] [Google Scholar]
- Itoh, N., Hayashi, H., Nishikawa, A., & Kohyama, Y. 1996, ApJS, 102, 411 [NASA ADS] [CrossRef] [Google Scholar]
- Jeffery, C. S., & Saio, H. 2013, MNRAS, 435, 885 [NASA ADS] [CrossRef] [Google Scholar]
- Kawaler, S. D., & Bradley, P. A. 1994, ApJ, 427, 415 [NASA ADS] [CrossRef] [Google Scholar]
- Kawaler, S. D., Winget, D. E., Iben, Jr., I., & Hansen, C. J. 1986, ApJ, 302, 530 [NASA ADS] [CrossRef] [Google Scholar]
- Kepler, S. O. 2012, in Progress in Solar/Stellar Physics with Helio- and Asteroseismology, ed. H. Shibahashi, ASP Conf. Ser., 462, 322 [Google Scholar]
- Kepler, S. O., Costa, J. E. S., Castanheira, B. G., et al. 2005, ApJ, 634, 1311 [Google Scholar]
- Kilic, M., Brown, W. R., Allen de Prieto, C., et al. 2011, ApJ, 727, 3 [NASA ADS] [CrossRef] [Google Scholar]
- Kilic, M., Brown, W. R., Allen de Prieto, C., et al. 2012, ApJ, 751, 141 [NASA ADS] [CrossRef] [Google Scholar]
- Kilic, M., Hermes, J. J., Gianninas, A., & Brown, W. R. 2015, MNRAS, 446, L26 [NASA ADS] [CrossRef] [Google Scholar]
- Koester, D., Voss, B., Napiwotzki, R., et al. 2009, A&A, 505, 441 [NASA ADS] [CrossRef] [EDP Sciences] [Google Scholar]
- Magni, G., & Mazzitelli, I. 1979, A&A, 72, 134 [NASA ADS] [Google Scholar]
- Maxted, P. F. L., Anderson, D. R., Burleigh, M. R., et al. 2011, MNRAS, 418, 1156 [NASA ADS] [CrossRef] [Google Scholar]
- Maxted, P. F. L., Serenelli, A. M., Miglio, A., et al. 2013, Nature, 498, 463 [NASA ADS] [CrossRef] [PubMed] [Google Scholar]
- Maxted, P. F. L., Serenelli, A. M., Marsh, T. R., et al. 2014, MNRAS, 444, 208 [NASA ADS] [CrossRef] [Google Scholar]
- Mestel, L. 1952, MNRAS, 112, 583 [NASA ADS] [CrossRef] [Google Scholar]
- Mukadam, A. S., Kepler, S. O., Winget, D. E., et al. 2003, ApJ, 594, 961 [NASA ADS] [CrossRef] [Google Scholar]
- Mukadam, A. S., Bischoff-Kim, A., Fraser, O., et al. 2013, ApJ, 771, 17 [NASA ADS] [CrossRef] [Google Scholar]
- Mullally, F., Winget, D. E., Degennaro, S., et al. 2008, ApJ, 676, 573 [NASA ADS] [CrossRef] [Google Scholar]
- Osaki, J. 1975, PASJ, 27, 237 [NASA ADS] [Google Scholar]
- Rappaport, S., Nelson, L., Levine, A., et al. 2015, ApJ, 803, 82 [NASA ADS] [CrossRef] [Google Scholar]
- Redaelli, M., Kepler, S. O., Costa, J. E. S., et al. 2011, MNRAS, 415, 1220 [NASA ADS] [CrossRef] [Google Scholar]
- Scuflaire, R. 1974, A&A, 36, 107 [NASA ADS] [Google Scholar]
- Steinfadt, J. D. R., Bildsten, L., & Arras, P. 2010, ApJ, 718, 441 [NASA ADS] [CrossRef] [Google Scholar]
- Steinfadt, J. D. R., Bildsten, L., Kaplan, D. L., et al. 2012, PASP, 124, 1 [NASA ADS] [CrossRef] [Google Scholar]
- Sullivan, D. J., & Chote, P. 2015, in 19th European Workshop on White Dwarfs, eds. P. Dufour, P. Bergeron, & G. Fontaine, ASP Conf. Ser., 493, 199 [Google Scholar]
- Tassoul, M., Fontaine, G., & Winget, D. E. 1990, ApJS, 72, 335 [Google Scholar]
- Unno, W., Osaki, Y., Ando, H., Saio, H., & Shibahashi, H. 1989, Nonradial oscillations of stars (University of Tokyo Press) [Google Scholar]
- Van Grootel, V., Fontaine, G., Brassard, P., & Dupret, M.-A. 2013, ApJ, 762, 57 [NASA ADS] [CrossRef] [Google Scholar]
- van Kerkwijk, M. H., Rappaport, S. A., Breton, R. P., et al. 2010, ApJ, 715, 51 [NASA ADS] [CrossRef] [Google Scholar]
- Vauclair, G., Fu, J.-N., Solheim, J.-E., et al. 2011, A&A, 528, A5 [NASA ADS] [CrossRef] [EDP Sciences] [Google Scholar]
- Winget, D. E., & Kepler, S. O. 2008, ARA&A, 46, 157 [NASA ADS] [CrossRef] [EDP Sciences] [Google Scholar]
- Winget, D. E., Hansen, C. J., & van Horn, H. M. 1983, Nature, 303, 781 [NASA ADS] [CrossRef] [Google Scholar]
- Winget, D. E., Sullivan, D. J., Metcalfe, T. S., Kawaler, S. D., & Montgomery, M. H. 2004, ApJ, 602, L109 [NASA ADS] [CrossRef] [Google Scholar]
- Zhang, X. B., Fu, J. N., Li, Y., Ren, A. B., & Luo, C. Q. 2016, ApJ, 821, L32 [NASA ADS] [CrossRef] [Google Scholar]
All Tables
The absolute value of the upper limit of the theoretical rates of period change, (in units of 10-15 s/s), for selected ℓ = 1g modes, corresponding to low-mass WD models with effective temperatures in the range 8000 ≲ Teff ≲ 10 000 K.
The absolute value of the maximum expected rates of period change, (s/s), and the sign, for nonradial ℓ = 1g and p modes (and p−g mixed modes in the case of pre-ELMVs), and for radial (ℓ = 0) modes corresponding to low-mass WD and pre-WD models and also objects evolving just before the CNO flashes.
All Figures
|
Fig. 1 Teff−log g plane showing the low-mass He-core WD evolutionary tracks (final cooling branches) of Althaus et al. (2013). Numbers correspond to the stellar mass of each sequence. The location of the ten known ELMVs (Hermes et al. 2012, 2013c,a; Kilic et al. 2015; Bell et al. 2015, 2016) are marked with large red circles (Teff and log g computed with 3D model atmospheres corrections). Stars observed not to vary (Steinfadt et al. 2012; Hermes et al. 2012, 2013c,a) are depicted with small black circles. The gray squares and triangles on the evolutionary tracks indicate the location of the template models analyzed in the text. The dashed blue line corresponds to the blue edge of the instability domain of ℓ = 1g modes according to the nonadiabatic computations of Córsico & Althaus (2016) using ML2 (α = 1.0) version of the MLT theory of convection. |
| In the text | |
|
Fig. 2 Left: rates of period change of ℓ = 1g modes versus the pulsation periods, corresponding to WD models characterized by an effective temperature of Teff ~ 9000 K and different stellar masses (0.1554 ≤ M⋆/M⊙ ≤ 0.4352). Middle: same as in left panel, but for ℓ = 1p modes. Right: same as in left panel, but for radial (ℓ = 0) modes. |
| In the text | |
|
Fig. 3 Left: rates of period change of ℓ = 1g modes versus the pulsation periods, corresponding to WD models characterized by a stellar mass M⋆ = 0.1762 M⊙ and different effective temperatures. Middle: similar to left panel, but for ℓ = 1p modes. Right: similar to left panel, but for radial (ℓ = 0) modes. |
| In the text | |
|
Fig. 4 Left: rates of period change of ℓ = 1g modes versus the pulsation periods, corresponding to WD models characterized by a stellar mass M⋆ = 0.1863 M⊙ and different effective temperatures. Middle: similar to the left panel, but for ℓ = 1p modes. Right: similar to the left panel, but for radial (ℓ = 0) modes. |
| In the text | |
|
Fig. 5 Left: absolute value of the maximum rate of period change in terms of the stellar mass corresponding to ℓ = 1g modes with selected radial orders k, for WD models with effective temperatures in the range 8000 ≲ Teff ≲ 10 000 K. Middle: same as in the left panel, but for ℓ = 1p modes. Right: same as in the left panel, but for radial (ℓ = 0) modes. |
| In the text | |
|
Fig. 6 Teff−log g diagram showing our low-mass He-core pre-WD evolutionary tracks (thin dotted black lines) computed neglecting element diffusion. Numbers correspond to the stellar mass of each sequence. Green circles with error bars correspond to the known pre-ELMV stars (Maxted et al. 2013, 2014; Corti et al. 2016; Gianninas et al. 2016; Zhang et al. 2016), and small black circles depict the location of pre-ELM (nonvariable) WDs observed in the Kepler mission field (Rappaport et al. 2015; van Kerkwijk et al. 2010; Carter et al. 2011; Breton et al. 2012). The dashed blue line indicates the nonradial dipole (ℓ = 1) blue edge of the pre-ELMV instability domain due to the κ−γ mechanism acting at the He+ −He++ partial ionization region, as obtained in Córsico et al. (2016a). The gray squares and triangles on the evolutionary tracks indicate the location of the template models analyzed in the text. |
| In the text | |
|
Fig. 7 Evolution of the pulsation periods of p, g, and p−g mixed modes with ℓ = 1 from low to high Teff values for pre-WD models with M⋆ = 0.1763 M⊙. We note the multiple avoided crossings experienced for the modes with periods in the range 250−2000 s. |
| In the text | |
|
Fig. 8
|
| In the text | |
|
Fig. 9 Left: rates of period change versus the pulsation periods of ℓ = 1g, p, and p−g mixed modes, corresponding to low-mass pre-WD models characterized by an effective temperature of Teff ~ 10 500 K and different stellar masses (0.1554 ≤ M⋆/M⊙ ≤ 0.2390). Right: same as in left panel, but for radial (ℓ = 0) modes. |
| In the text | |
|
Fig. 10 Left: rates of period change versus the pulsation periods of ℓ = 1g, p, and p−g mixed modes, corresponding to low-mass pre-WD models characterized by a stellar mass M⋆ = 0.1703 M⊙ and different effective temperatures. Right: similar to left panel, but for radial (ℓ = 0) modes. |
| In the text | |
|
Fig. 11 Left: evolutionary track of the 0.1821 M⊙ sequence in the log Teff−log g diagram. Red (green) circles mark the location of the known ELMV (pre-ELMV) stars. The gray square corresponds to a template model located shortly before the last CNO flash occurs. The arrows on the track indicate the sense of time evolution. Right: same as in left panel, but for the 0.2724 M⊙ sequence. |
| In the text | |
|
Fig. 12 Left: internal chemical abundances of H and He (upper panel) and the logarithm of the squared Brunt-Väisälä and Lamb frequencies (lower panel) in terms of the mass coordinate [−log (1−Mr/M⋆)] corresponding to the pre-CNO flash template model with M⋆ = 0.1821 M⊙ and Teff = 13 446 K whose location in the log Teff−log g diagram is indicated in the left panel of Fig. 11. Right: same as in left panel, but for the pre-CNO flash template model with 0.2724 M⊙ and Teff = 16 481 K. Its location in the log Teff−log g plane plane is indicated in the right panel of Fig. 11. |
| In the text | |
|
Fig. 13 Left: rates of period change (in units of 10-15 s/s) of ℓ = 1g modes corresponding to the pre-CNO flash template model with M⋆ = 0.1821 M⊙ and Teff = 13 446 K (see the left panels of Fig. 12). Middle: same as in left panel, but for ℓ = 1p modes. Right: same as in left panel, but for radial (ℓ = 0) modes. |
| In the text | |
|
Fig. 14 Left: rate of period change (in units of 10-15 s/s) of ℓ = 1g modes corresponding to the pre-CNO flash template model with M⋆ = 0.2724 M⊙ and Teff = 16 481 K (see the right panels of Fig. 12). Middle: same as in left panel, but for ℓ = 1p modes. Right: same as in left panel, but for radial (ℓ = 0) modes. |
| In the text | |
Current usage metrics show cumulative count of Article Views (full-text article views including HTML views, PDF and ePub downloads, according to the available data) and Abstracts Views on Vision4Press platform.
Data correspond to usage on the plateform after 2015. The current usage metrics is available 48-96 hours after online publication and is updated daily on week days.
Initial download of the metrics may take a while.