| Issue |
A&A
Volume 600, April 2017
|
|
|---|---|---|
| Article Number | A107 | |
| Number of page(s) | 6 | |
| Section | Galactic structure, stellar clusters and populations | |
| DOI | https://doi.org/10.1051/0004-6361/201630213 | |
| Published online | 06 April 2017 | |
Diffuse γ-ray emission near the young massive cluster NGC 3603
1 Max-Planck-Institut für Kernphysik, PO Box 103980, 69029 Heidelberg, Germany
e-mail: This email address is being protected from spambots. You need JavaScript enabled to view it.
2 Dublin Institute for Advanced Studies, 31 Fitzwilliam Place, Dublin 2, Ireland
Received: 7 December 2016
Accepted: 27 January 2017
Abstract
We report the detailed analysis of Fermi Large Area Telescope’s data towards the direction of the young massive star cluster NGC 3603. The emission shows a hard spectrum with a photon index of 2.3 ± 0.1 from 1 GeV to 250 GeV. The spatial correlation with the ionised gas indicates a hadronic origin. The total cosmic ray (CR) protons energy budget is estimated to be of the order of 1050 erg assuming the γ-rays are produced in the interaction of CRs with ambient gas. The environment and spectral features show significant similarity with the GeV emission seen from the Cygnus cocoon. The emission can be produced by a pulsar wind nebular or by the super bubble associated with the young star clusters. In the latter case, it further establishes that young star clusters may be a γ-ray source population and that they can potentially accelerate a significant fraction of the Galactic cosmic rays.
Key words: gamma rays: ISM / galaxies: star clusters: individual: NGC 3603
© ESO, 2017
1. Introduction
The current paradigm of cosmic rays (CRs) postulates that the acceleration sites of CRs are supernova remnants (SNRs). The recent measurements of 60Fe abundance in CRs (Binns et al. 2016) indicate that a substantial fraction of CRs could be accelerated in young OB star clusters and related super bubbles. Furthermore, the measurements of the Galactic diffuse γ-ray emission show that the CRs have a similar radial distribution to OB stars rather than SNRs (Acero et al. 2016; Yang et al. 2016). On the other hand, super bubbles have sufficient kinetic energies, supplied by supernova explosions therein or collective stellar winds, to provide the flux of locally measured CRs (Parizot et al. 2004). Meanwhile, these objects should be visible in γ-rays, due to the fresh accelerated CRs interacting with ambient gas. So far the only firm detection of such sources in our galaxy is the Cygnus cocoon. Westerlund 1 is also detected in both the GeV and TeV energy ranges (Ohm et al. 2013; Abramowski et al. 2012), but whether the γ-ray emission is from the super bubble is not clear (Ohm et al. 2013). We note that the Cygnus OB system is not the most powerful young star cluster in our Galaxy.
To search for other analogues we have chosen NGC 3603, which is the densest young star cluster in our Galaxy. NGC 3603 is located 6.9±0.6 kpc (Sung & Bessell 2004) from the solar system and is regarded as the Galactic clone of the core of 30 Doradus in Large Magellanic cloud. We note that 30 Doradus C suppressible is detected by H.E.S.S in the TeV range, and is regarded as a powerful accelerator (H.E.S.S. Collaboration et al. 2015). Also, NGC 3603 is one of the most massive H ii regions in our Galaxy (Moffat et al. 1994). The age of NGC 3603 is about 2 Myr (Kudryavtseva et al. 2012). It contains more than 50 OB stars and Wolf-Rayet stars in a very compact region. These stellar winds from massive young stars provide sufficient kinetic energy to accelerate CRs. The extended γ-ray emission towards this direction was also reported in Ackermann et al. (2016).
We have structured the paper as follows. In Sect. 2, we present the results of our analysis of the Fermi-LAT observations. In Sect. 3 we discuss the origin of the γ-ray emission. We estimate the mass of gas in the based on the dust opacity maps, and derive the CR spectra and fluxes assuming that γ-rays are produced in interactions of CR protons and nuclei with the ambient gas. In Sect. 4 we discuss other possible origins of the γ-ray emission. In Sect. 5 we show the results of the reanalysis of the Cygnus cocoon with updated software and increased exposure. In Sect. 6 we present the main conclusion of this work.
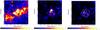 |
Fig. 1 Left: gamma-ray counts map above 10 GeV in the inner 5° around NGC 3603. The identified 3FGL catalogue sources are labelled with red crosses. The two unassociated catalogue sources are labelled with green crosses. The position of NGC 3603 is marked as a magenta diamond. Middle: residual map after subtracting all the identified catalogue sources and the diffuse background. Right: residual map after subtracting all the identified catalogue sources and the diffuse background, as well as the unassociated catalogue source 3FGL 1111.9-6038. Also shown is the best-fit 2D Gaussian template (white circle, the radius corresponds to the 1σ of the Gaussian), the position and extension of 2FHL J1112.1-6101e (green circle), and the position of the five point sources (white “x”) used to test the hypothesis that the extended emission comes from several independent point sources. |
2. Fermi-LAT data analysis
2.1. Spatial analysis
We selected Fermi-LAT detector data towards NGC 3603 for a period of approximately 7 years (MET 239557417–MET 455067824). For this analysis, we used the standard LAT analysis software package v10r0p51. Given the crowded nature of the region and to avoid systematic errors due to the poor angular resolution at low energies, we selected only events with energies exceeding 10 GeV for the spatial analysis. We also note that pulsar emissions dominate below several GeV in the Galactic plane. Thus, in the energy range above 10 GeV we can significantly reduce the contamination from nearby pulsars. The region of interest (ROI) was selected to be a 15° × 15° square centred on the position of NGC 3603, i.e. RA =  , Dec =
  . In order to reduce the effect of the Earth albedo background, we excluded from the analysis the time intervals when the Earth was in the field of view (specifically when the centre of the field of view was more than 52° from zenith), and the time intervals when parts of the ROI had been observed at zenith angles > 90°. The spectral analysis was performed based on the P8_R2_v6 version of the post-launch instrument response functions (IRFs). Both the front and back converted photons were selected.
Fitting results for different models.
The γ-ray counts map above 10 GeV of the inner 5° is shown in the top left panel of Fig. 1. The identified Fermi-LAT point sources listed in the 3rd Fermi source catalogue (3FGL; Acero et al. 2015) are also shown as red crosses. In this region pulsars dominate the point source population. There are also two unassociated Fermi point sources near NGC 3603, which are marked as green crosses in the figure. To derive the emission related to NGC 3603 we performed a binned likelihood analysis by using the tool gtlike. In the likelihood fitting we first included all the sources in the 3FGL catalogue and the Fermi diffuse background model gll_iem_v06.fits for the Galactic γ-ray emission, as well as the isotropic background model iso_P8R2_SOURCE_V6_v06.txt2. The normalisations and spectral indices of the sources were left free in the analysis.
After the likelihood fitting, we subtracted the best-fit diffuse model and all the identified sources in the ROI; the resulting residual maps are shown in top right panel of Fig. 1. We found strong residuals towards the direction of NGC 3603 (purple diamond) and the unassociated Fermi source 3FGL 1111.9-6038. Slane et al. (2012) reveals that this source 3FGL 1111.9-6038 should be related to the supernova remnant MSH 11-62. The other unassociated Fermi source 3FGL 1112.0-6135, is not significant above 10 GeV and thus has little influence on the results. We then further subtracted the source 3FGL 1111.9-6038 and the residuals are shown in the bottom panel of Fig. 1. A diffuse emission peaks at the position of NGC 3603.
To study the morphology of the diffuse emission, we added a Gaussian disc on top of the model used in the likelihood analysis. We then varied the position and size of the disc to find the best-fit parameters. The best-fit result is a Gaussian disc centred at (RA =  , Dec =
  ) with σ = 1.1° ± 0.1, with a TS value of 114, corresponding to a significance of more than 10σ. We also test whether this extended emission is composed of several independent point sources. To do this we added five point source at the peaks in the residual maps. These point sources are shown as red crosses in the bottom panel of Fig. 1. These point sources are not significant except for the one which coincides in position with NGC 3603. And the −log(likelihood) function value is larger than that in the 2D Gaussian template case, even with more free parameters. We also note that the morphology of the residual reveal the hint for deviation from a simple Gaussian disc, but the limited statistics prevent us from pursuing this issue. Thus in the following analysis we use the best-fit Gaussian disc as the spatial template. We list the model and the −log(likelihood) value in Table 1.
The diffuse emission spatially coincides with the 2FHL catalogue source 2FHL J1112.1-6101e, which is also shown in the lower panel of Fig. 1. The spatial extension of 2FHL J1112.1-6101e is about  (Ackermann et al. 2016), which is significantly lower than the diffuse emission discussed in this paper. The difference morphology may have several causes. Firstly, in deriving the 2FHL sources the energy range above 50 GeV was selected, rather than above 10 GeV in this work. In addition, all the 3FGL catalogue sources are not included in the analysis for 2FHL sources; the exclusion of these point sources may cause a different best-fit normalisation of the diffuse background levels in the likelihood analysis procedure. Furthermore, 2FHL J1112.1-6101e should also contain contributions from 3FGL 1111.9-6038, which was subtracted from our analysis.
2.2. Spectral analysis
For spectral analysis we applied gtlike to the whole energy range and modelled the spectrum of NGC 3603 as a power law function, the derived photon index of 2.28±0.14(stat)±0.1(sys). The total flux above 1 GeV is 2.1 ± 0.2 × 10⁻⁸ cm-2 s-1. The systematic errors come from the uncertainties of effective area and point spread function of LAT (Ackermann et al. 2012a). The derived spectrum is consistent with the results of 2FHL J1112.1-6101e in Ackermann et al. (2016).
To obtain the spectral energy distribution (SED) of extended emission towards NGC 3603, we divided the energy range 1−250 GeV into eight logarithmically spaced bands and applied gtlike to each of these bands. The results of this analysis are shown in Fig. 2. All data points have test statistic (TS) values larger than 4, which corresponds to a significance greater than 2σ. The power law spectrum extends to 250 GeV without any sign of cut-off. The total γ-ray luminosity above 1 GeV is 1036 erg/s given the distance of 7 kpc. In addition, we also plot the SED for the source 3FGL 1111.9-6038, which reveals a break above about 20 GeV.
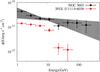 |
Fig. 2 SEDs of the extended emission towards NGC 3603 and 3FGL 1111.9-6038. The grey region is the bowtie plot for the best-fit power law spectrum. |
3. Cosmic rays accelerated in young star clusters
The young star cluster NGC 3603 contains more than 50 OB stars and Wolf-Rayet stars (Moffat et al. 1994); the collective wind and/or a possible past supernova explosion inside the cluster make it a potential accelerator of CRs (Parizot et al. 2004). The hard γ-ray emission has already been detected in the young star association Cygnus OB2 (Ackermann et al. 2011). NGC 3603 has more OB stars and a much denser star distribution than Cygnus OB2; these stars provide enough kinetic energy in the stellar wind and make it potentially an even more powerful accelerator. Thus, one explanation for the extended γ-rays is the freshly accelerated CRs illuminating the ambient gas.
The gas content can be investigated by various tracers. The traditional tracers of the hydrogen in the atomic and molecular forms are the 21 cm H i and 2.6 mm CO lines, respectively. In this paper we use the data from CO galactic survey of Dame et al. (2001) with the CfA 1.2 m millimetre-wave Telescope, and the Leiden/Argentine/Bonn (LAB) Survey on H i gas (Kalberla et al. 2005). For the CO data, we use the standard assumption of a linear relationship between the velocity-integrated CO intensity, WCO, and the column density of molecular hydrogen, N(H2). The conversion factor XCO is chosen to be 2.0 × 1020 cm-2(K km s-1)-1 as suggested by Dame et al. (2001)and Bolatto et al. (2013).For the H i data we use the equation 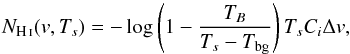 (1)where Tbg ≈ 2.66 K is the brightness temperature of the cosmic microwave background radiation at 21 cm, and Ci = 1.83 × 1018 cm2. In the case when TB>Ts−5 K, we truncate TB to Ts−5 K; Ts is chosen to be 150 K. The systematic uncertainties due to the different spin temperatures are discussed in Ackermann et al. (2012b) and Acero et al. (2016) and the effect is quite small in most regions of the sky. Hummel et al. (2015) has revealed that for NGC 3603 most of the CO emission falls into the velocity range of 0−20 km s-1. We also use this range to integrate the line emission of CO and 21 cm in this velocity range.
For different reasons, the neutral gas cannot always be traced by CO and H i observations (Grenier et al. 2005). In such cases (e.g. in optically thick clouds), the infrared emission from cold interstellar dust provides an alternative tracer and independent measurements of the gas column density. To find it, we need a relation between the dust opacity and the column density. According to Eq. (4) of Planck Collaboration XIX (2011),![Mathematical equation: \begin{equation} \tau_M(\lambda) = \left(\frac{\tau_D(\lambda)}{N_{\rm H}}\right)^{\rm dust}[N_{{\rm HI}}+2X_{\rm CO}W_{\rm CO}], \label{eq:dust} \end{equation}](/articles/aa/full_html/2017/04/aa30213-16/aa30213-16-eq42.png) (2)where τM is the dust opacity as a function of the wavelength λ, (τD/NH)dust is the reference dust emissivity measured in low-NH regions, WCO is the integrated brightness temperature of the CO emission, and XCO = NH2/WCO is the H2/ CO conversion factor. The substitution of the last into Eq. (2) gives
(2)where τM is the dust opacity as a function of the wavelength λ, (τD/NH)dust is the reference dust emissivity measured in low-NH regions, WCO is the integrated brightness temperature of the CO emission, and XCO = NH2/WCO is the H2/ CO conversion factor. The substitution of the last into Eq. (2) gives ![Mathematical equation: \begin{equation} N_{\rm H} = N_{{\rm HI}} +2 N_{\rm H_2} = \tau_m(\lambda)\left[\left(\frac{\tau_D(\lambda)}{N_{\rm H}}\right)^{\rm dust}\right]^{-1}\cdot \end{equation}](/articles/aa/full_html/2017/04/aa30213-16/aa30213-16-eq49.png) (3)Here for the dust emissivity at 353 GHz, we use
(3)Here for the dust emissivity at 353 GHz, we use  =1.18 ± 0.17 × 10⁻²⁶ cm2 taken from Table 3 of Planck Collaboration XIX (2011). Generally, the dust opacity is considered as a robust and reliable estimate of the gas column density. On the other hand, the dust opacity maps do not contain any information on the distance. Thus the column derived from dust opacity is the integration over the whole line of sight and should be regarded as an upper limit.
 |
Fig. 3 Left: gas column derived from Planck dust opacity maps. Middle: gas column derived from 21 cm and CO data; the velocity range of 0−20 km s-1 is chosen to integrate. Right: H ii column derived from the Planck free-free maps. The γ-ray emission is presented as green contours. |
NGC 3603 is the most massive H ii region in the Galaxy. To determine the H ii column we used the Planck free-free map (Planck Collaboration X 2016). We first converted the emission measure (EM) in the Planck map into free-free intensity by using the conversion factor in Table 1 of Finkbeiner (2003). Then we used Eq. (5) of Sodroski et al. (1997) to calculate the H ii column from free-free intensity. We note that the derived H ii column is inversely proportional to electron density ne, which are chosen here to be 2 cm-3 and 10 cm-3 (Sodroski et al. 1997) as an upper and lower limit.
The derived gas columns of all three phases are shown in Fig. 3. We note that the γ-ray emission shows good spatial correlation with the H ii map, which supports the hypothesis that the emission comes from the interaction of the freshly accelerated CRs with the ambient gas in the super bubble. The mass of gas corresponding to the diffuse emission can be determined from the gas column by assuming a distance of 7 kpc. The derived masses for different traces are listed in Table 2. As mentioned above, the mass derived from dust opacity can be regarded as an upper limit. The lower limit of the mass can be estimated as the summation of the H i, H2, and the H ii mass estimated by assuming ne = 10 cm-3. Thus, the total mass can be estimated in the range 2.2×10⁶M⊙ < M < 12.0×10⁶M⊙. If we assume the γ-ray emission region is spherical in geometry, then the radius can be estimated as r = Dθ ~ 7.0 kpc × (1.1/57.29) rad ~ 130 pc. Thus, the average volume gas density is 10 cm-3 <ngas < 60 cm-3. Taking into account the total γ-ray luminosity of 1036 erg/s, it is possible to derive the total CR content in this area of 2−10 × 1049 erg assuming that all γ-rays have a hadronic origin. This value is comparable to the total CR content in the Cygnus cocoon estimated as 1.3×1049 erg (Ackermann et al. 2011).
Gas mass derived from different tracers.
4. Other possible origins of the extended γ-ray emission
The region near NGC 3603 is very crowded with several pulsars and supernova remnants. The γ-ray emission from pulsars typically has a cut-off at several GeV, thus can hardly contribute to the hard γ-rays detected in the extended structures. However, the pulsar wind nebulae (PWN) and SNRs can be natural contributors to hard γ-rays. We might also expect some contribution from the enhanced diffuse emission of this region. Furthermore, the crowded nature and the limited understanding of the interstellar medium in this region also introduce large uncertainties of the modelling of the Galactic diffuse γ-ray background. In this case the residuals may be due to the imperfect modelling of the diffuse background. Below we investigate these possibilities in detail.
4.1. Supernova remnants
There are three SNRs located inside the γ-ray emission region, SNR G290.1-0.8 (MSH 11-61A) (Slane et al. 2002), G291.0-0.1 (MSH 11-62) (Slane et al. 2012), and G292.2-0.5 (Ng et al. 2012). All three SNRs have a much smaller radio size compared to the size of the detected extended γ-ray emission. Thus, the extended emission can hardly be related to the SNRs themselves.
The CRs escaping from SNRs can also produce γ-rays by interacting with ambient gas. The age of SNR G290.1-0.8 and SNR G291.0-0.1 are 6000 and 1900 yr, respectively. In such a short time scale the CRs cannot propagate more than 100 pc even if we assume a diffusion coefficient of 1029 cm/s2 near the SNRs. This value is similar to the average diffusion coefficient inside the Galactic plane. Indeed, owing to the more turbulent environment near SNRs a much slower diffusion is predicted. With an age of more than 2 × 10⁴ yr, G292.2-0.5 is old enough for the accelerated CRs to occupy the γ-ray emission region.
4.2. PWNs
There are in total eight pulsars which coincide with the γ-ray emission region. Five of them are old with a rather low spin-down luminosity (< 1034 erg). The remaining three are PSR J1105-6107, J1112-6103, and J1119-61273. PSR J1119-6127 has an age of only 1600 yr (Camilo et al. 2000) and a distance of 8.4 kpc. If the source is associated with this pulsar, the physical radius of the extended γ-ray emission will be as large as 150 pc, which can hardly be produced by such young pulsars. Thus, PSR J1119-6127 can be excluded. PSR J1105-6107 has an age of about 6 × 10⁴ yr and a distance of 2.5 kpc. The PWN of PSR J1105-6107 has been detected in X-ray (Gotthelf & Kaspi 1998) and radio (Stappers et al. 1999), but with an angular size which is one order of magnitude smaller. We cannot rule out the possibility that the morphology of the X-ray and radio emissions are totally different. But the one order of magnitude difference in size is quite unusual. PSR J1112-6103 has a distance of 4.5 kpc and an age of 3.3 × 10⁴ yr. Prinz & Becker (2015) have performed a X-ray search for all the pulsars and found no evidence towards the direction of PSR J1112-6103. Ackermann et al. (2016) argued that extended emission 2FHL J1112.1-6101e may be connected with the PWN of this pulsar. We note, however, that the uncertainty of the distance of this pulsar is large, ranging from 4.5 kpc by using the free electron density model of Yao et al. (2017) to more than 12 kpc by using the model of Cordes & Lazio (2002). If the distance is as far as 12 kpc, the size of this source will be more than 200 pc and can hardly be interpreted as a PWN. In conclusion, we cannot rule out the PWN of PSR J1105-6107, J1112-6103, or even some unknown pulsars as the origin of the extended emission. The multiwavelength observations may help to determine this scenario.
4.3. Imperfect modelling of diffuse background
The Galactic diffuse γ-ray background of Fermi-LAT is produced by using the GALPROP code (Vladimirov et al. 2011). In the previous analysis various point sources concentrated in the Galactic plane have been regarded as being related to the imperfect modelling of the Galactic diffuse background, which is labelled “c” in the Fermi catalogue (Acero et al. 2015). Near NGC 3603 there are no such sources. On the other hand, in the Fermi Galactic diffuse backgound models, the γ-rays associated with ionised gas are not included (Acero et al. 2016). As mentioned in the last section, NGC 3603 is the most massive H ii region in the Galaxy. Thus, when no H ii gas is considered the γ-ray flux towards this direction may be underestimated significantly. However, the hard spectrum with an index of 2.3 is not compatible with the Galactic diffuse γ-ray background which has an index of 2.7 and which is mainly contributed by the CR interaction with gas. We plot in Fig. 4 the SED of NGC 3603 together with the predicted γ-ray emission in the H ii region assuming that the CR density therein is identical to the density in the solar system measured by AMS-02 (Aguilar et al. 2015). The observed flux is two times higher than the predicted level at 1 GeV and nearly two orders of magnitude higher at 200 GeV. Thus, the extended emissions are unlikely to be related to the diffuse background components.
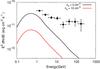 |
Fig. 4 SEDs of the extended emission towards NGC 3603 together with the predicted γ-ray emission in the H ii region assuming that the CR density therein is identical to the density in the solar system measured by AMS-02 (Aguilar et al. 2015). The H ii density is derived by using Eq. (5) of Sodroski et al. (1997) and free-free intensity from Planck Collaboration X (2016). The electron density ne is chosen to be 2 cm-3 and 10 cm-3, as shown by the black and red curve, respectively. |
5. Reanalysis of PASS 8 data on the Cygnus cocoon
The Cygnus cocoon (Ackermann et al. 2011) is the first detected extended γ-ray emission near young star clusters. The γ-ray emission has a hard spectrum with a photon index in the range of −2.1 up to 100 GeV and and has a radius of 2°. The hard spectrum of the Cygnus cocoon reported by Ackermann et al. (2011) shows a similarity with NGC 3603. To take advantage of the accumulated exposure and developed understanding of instrument response, we reanalysed the region using seven years of PASS 8 Fermi-LAT data (MET 239557417–MET 455067824) with the latest LAT analysis software package v10r0p5. The Cygnus cocoon is already included in the 3FGL template and we use the spatial templates therein. We divided the energy range 1−500 GeV into nine logarithmically spaced bands and applied gtlike to each of these bands. The derived SEDs of the Cygnus cocoon are shown in Fig. 5, which is consistent with the results in Ackermann et al. (2011) except that the SED is now extended to 500 GeV. The spectrum above 1 GeV can be well fitted with a power law with a photon index of 2.3 ± 0.1. The detected spectrum extends to 500 GeV without a clear sign of cut-off. The corresponding energy of the underlying accelerated proton population extends hence up to 10 TeV (see e.g. Kelner et al. 2006).
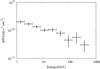 |
Fig. 5 SEDs of cygnus cocoon. |
6. Discussion and conclusion
Originally, Montmerle (1979) and Cesarsky & Montmerle (1983) proposed that Galactic CRs can be produced in the supper bubbles close to OB associations/star-clusters. Binns et al. (2005) and Rauch et al. (2009) have also suggested superbubbles as the places where CR acceleration occurs because of the observed secondary CR abundances. The recent observations of 60Fe in CRs provide new support for this hypothesis (Binns et al. 2016). Furthermore, the measurements of γ-ray emissivities reveal a similar radial distribution of CRs with OB stars (Acero et al. 2016; Yang et al. 2016). If CRs are accelerated in such environments, high energy γ-rays are expected from the interactions of the freshly accelerated CRs with the ambient gas. However, to day the only γ-ray detections towards these structures are the Cygnus cocoon (Ackermann et al. 2011), 30 Doradus C (H.E.S.S. Collaboration et al. 2015), and Westerlund 1 (Abramowski et al. 2012; Ohm et al. 2013). Here, we report a statistically significant detection of an extended γ-ray signal from the direction of another starburst region, NGC 3603. Like the Cygnus cocoon, the spectrum of this source is hard, and extends up to 250 GeV. We argue that the most likely origin of the detected emission is the interactions of CRs accelerated in the star cluster with the ambient gas.
In addition to the Cygnus cocoon and NGC 3603, there are a few more similar objects such as Westerlund 1, Westerlund 2, RSSG1, RSSG2, and RSSG3 (for a review, see Portegies Zwart et al. 2010), which can be considered as sites of CR accelerations and therefore as potential extended γ-ray sources. Interestingly, the first three of these objects have been reported as TeV γ-ray emitters (Abramowski et al. 2012; H.E.S.S. Collaboration et al. 2011; Aharonian et al. 2006), thus it is likely that particles in these objects are accelerated to multi-TeV energies. In this regard a principal question is whether these objects can also operate as PeVatrons, i.e. whether they can provide the bulk of the locally observed CRs up to the so-called knee around 1 PeV.
The most straightforward and unambiguous answer to this question would be the detection of γ-rays extending with a hard energy spectrum to energies well beyond 10 TeV. Apparently, because of the limited detection area, the Fermi-LAT observations cannot offer such measurements. In this regard the Atmospheric Cherenkov Telescope Arrays with their huge detection areas and adequate angular and energy resolutions are powerful tools for the search and study of cosmic PeVatrons. Remarkably, multi-TeV γ-ray emission with a hard spectrum has been reported from Westerlund 1 by by the HESS collaboration (Abramowski et al. 2012) and has been interpreted by Bykov (2014) as an indication of acceleration of protons in that object to PeV energies. However, this tentative result needs further confirmation.
The forthcoming Cherenkov Telescope Array (CTA), and to some extent also the water Cherenkov particle detectors like HAWK and LHAASO, are well designed for such studies.
The distance, age, and spin-down power of these pulsars can be found in the ATNF pulsar catalogue http://www.atnf.csiro.au/research/pulsar/psrcat
References
- Abramowski, A., Acero, F., Aharonian, F., et al. 2012, A&A, 537, A114 [NASA ADS] [CrossRef] [EDP Sciences] [Google Scholar]
- Acero, F., Ackermann, M., Ajello, M., et al. 2015, ApJS, 218, 23 [Google Scholar]
- Acero, F., Ackermann, M., Ajello, M., et al. 2016, ApJS, 223, 26 [NASA ADS] [CrossRef] [Google Scholar]
- Ackermann, M., Ajello, M., Allafort, A., et al. 2011, Science, 334, 1103 [NASA ADS] [CrossRef] [PubMed] [Google Scholar]
- Ackermann, M., Ajello, M., Albert, A., et al. 2012a, ApJS, 203, 4 [NASA ADS] [CrossRef] [Google Scholar]
- Ackermann, M., Ajello, M., Atwood, W. B., et al. 2012b, ApJ, 750, 3 [NASA ADS] [CrossRef] [Google Scholar]
- Ackermann, M., Ajello, M., Atwood, W. B., et al. 2016, ApJS, 222, 5 [NASA ADS] [CrossRef] [Google Scholar]
- Aguilar, M., Aisa, D., Alpat, B., & et al. 2015, Phys. Rev. Lett., 114, 171103 [CrossRef] [PubMed] [Google Scholar]
- Aharonian, F., Akhperjanian, A. G., Bazer-Bachi, A. R., et al. 2006, ApJ, 636, 777 [NASA ADS] [CrossRef] [Google Scholar]
- Binns, W. R., Wiedenbeck, M. E., Arnould, M., et al. 2005, ApJ, 634, 351 [NASA ADS] [CrossRef] [Google Scholar]
- Binns, W. R., Israel, M. H., Christian, E. R., et al. 2016, Science, 352, 677 [NASA ADS] [CrossRef] [PubMed] [Google Scholar]
- Bolatto, A. D., Wolfire, M., & Leroy, A. K. 2013, ARA&A, 51, 207 [Google Scholar]
- Bykov, A. M. 2014, A&ARv, 22, 77 [NASA ADS] [CrossRef] [Google Scholar]
- Camilo, F., Kaspi, V. M., Lyne, A. G., et al. 2000, ApJ, 541, 367 [NASA ADS] [CrossRef] [Google Scholar]
- Cesarsky, C. J., & Montmerle, T. 1983, Space Sci. Rev., 36, 173 [NASA ADS] [CrossRef] [Google Scholar]
- Cordes, J. M., & Lazio, T. J. W. 2002, ArXiv e-prints [arXiv:astro-ph/0207156] [Google Scholar]
- Dame, T. M., Hartmann, D., & Thaddeus, P. 2001, ApJ, 547, 792 [NASA ADS] [CrossRef] [Google Scholar]
- Finkbeiner, D. P. 2003, ApJS, 146, 407 [NASA ADS] [CrossRef] [Google Scholar]
- Gotthelf, E. V., & Kaspi, V. M. 1998, ApJ, 497, L29 [NASA ADS] [CrossRef] [Google Scholar]
- Grenier, I. A., Casandjian, J.-M., & Terrier, R. 2005, Science, 307, 1292 [NASA ADS] [CrossRef] [PubMed] [Google Scholar]
- H.E.S.S. Collaboration, Abramowski, A., Acero, F., et al. 2011, A&A, 525, A46 [Google Scholar]
- H.E.S.S. Collaboration, Abramowski, A., Aharonian, F., et al. 2015, Science, 347, 406 [NASA ADS] [CrossRef] [Google Scholar]
- Hummel, C. A., Stanke, T., Galván-Madrid, R., & Koribalski, B. S. 2015, A&A, 582, A66 [NASA ADS] [CrossRef] [EDP Sciences] [Google Scholar]
- Kalberla, P. M. W., Burton, W. B., Hartmann, D., et al. 2005, A&A, 440, 775 [NASA ADS] [CrossRef] [EDP Sciences] [Google Scholar]
- Kelner, S. R., Aharonian, F. A., & Bugayov, V. V. 2006, Phys. Rev. D, 74, 034018 [NASA ADS] [CrossRef] [Google Scholar]
- Kudryavtseva, N., Brandner, W., Gennaro, M., et al. 2012, ApJ, 750, L44 [NASA ADS] [CrossRef] [Google Scholar]
- Moffat, A. F. J., Drissen, L., & Shara, M. M. 1994, ApJ, 436, 183 [NASA ADS] [CrossRef] [Google Scholar]
- Montmerle, T. 1979, ApJ, 231, 95 [NASA ADS] [CrossRef] [Google Scholar]
- Ng, C.-Y., Kaspi, V. M., Ho, W. C. G., et al. 2012, ApJ, 761, 65 [NASA ADS] [CrossRef] [Google Scholar]
- Ohm, S., Hinton, J. A., & White, R. 2013, MNRAS, 434, 2289 [Google Scholar]
- Parizot, E., Marcowith, A., van der Swaluw, E., Bykov, A. M., & Tatischeff, V. 2004, A&A, 424, 747 [NASA ADS] [CrossRef] [EDP Sciences] [Google Scholar]
- Planck Collaboration XIX. 2011, A&A, 536, A19 [NASA ADS] [CrossRef] [EDP Sciences] [Google Scholar]
- Planck Collaboration X. 2016, A&A, 594, A10 [NASA ADS] [CrossRef] [EDP Sciences] [Google Scholar]
- Portegies Zwart, S. F., McMillan, S. L. W., & Gieles, M. 2010, ARA&A, 48, 431 [NASA ADS] [CrossRef] [Google Scholar]
- Prinz, T., & Becker, W. 2015, ApJ, submitted [arXiv:1511.07713] [Google Scholar]
- Rauch, B. F., Link, J. T., Lodders, K., et al. 2009, ApJ, 697, 2083 [NASA ADS] [CrossRef] [Google Scholar]
- Slane, P., Chen, Y., Lazendic, J. S., & Hughes, J. P. 2002, ApJ, 580, 904 [NASA ADS] [CrossRef] [Google Scholar]
- Slane, P., Hughes, J. P., Temim, T., et al. 2012, ApJ, 749, 131 [NASA ADS] [CrossRef] [Google Scholar]
- Sodroski, T. J., Odegard, N., Arendt, R. G., et al. 1997, ApJ, 480, 173 [NASA ADS] [CrossRef] [Google Scholar]
- Stappers, B. W., Gaensler, B. M., & Johnston, S. 1999, MNRAS, 308, 609 [NASA ADS] [CrossRef] [Google Scholar]
- Sung, H., & Bessell, M. S. 2004, AJ, 127, 1014 [NASA ADS] [CrossRef] [Google Scholar]
- Vladimirov, A. E., Digel, S. W., Jóhannesson, G., et al. 2011, Comput. Phys. Commun., 182, 1156 [NASA ADS] [CrossRef] [Google Scholar]
- Yang, R., Aharonian, F., & Evoli, C. 2016, Phys. Rev. D, 93, 123007 [Google Scholar]
- Yao, J. M., Manchester, R. N., & Wang, N. 2017, ApJ, 835, 29 [NASA ADS] [CrossRef] [Google Scholar]
All Tables
All Figures
|
Fig. 1 Left: gamma-ray counts map above 10 GeV in the inner 5° around NGC 3603. The identified 3FGL catalogue sources are labelled with red crosses. The two unassociated catalogue sources are labelled with green crosses. The position of NGC 3603 is marked as a magenta diamond. Middle: residual map after subtracting all the identified catalogue sources and the diffuse background. Right: residual map after subtracting all the identified catalogue sources and the diffuse background, as well as the unassociated catalogue source 3FGL 1111.9-6038. Also shown is the best-fit 2D Gaussian template (white circle, the radius corresponds to the 1σ of the Gaussian), the position and extension of 2FHL J1112.1-6101e (green circle), and the position of the five point sources (white “x”) used to test the hypothesis that the extended emission comes from several independent point sources. |
| In the text | |
|
Fig. 2 SEDs of the extended emission towards NGC 3603 and 3FGL 1111.9-6038. The grey region is the bowtie plot for the best-fit power law spectrum. |
| In the text | |
|
Fig. 3 Left: gas column derived from Planck dust opacity maps. Middle: gas column derived from 21 cm and CO data; the velocity range of 0−20 km s-1 is chosen to integrate. Right: H ii column derived from the Planck free-free maps. The γ-ray emission is presented as green contours. |
| In the text | |
|
Fig. 4 SEDs of the extended emission towards NGC 3603 together with the predicted γ-ray emission in the H ii region assuming that the CR density therein is identical to the density in the solar system measured by AMS-02 (Aguilar et al. 2015). The H ii density is derived by using Eq. (5) of Sodroski et al. (1997) and free-free intensity from Planck Collaboration X (2016). The electron density ne is chosen to be 2 cm-3 and 10 cm-3, as shown by the black and red curve, respectively. |
| In the text | |
|
Fig. 5 SEDs of cygnus cocoon. |
| In the text | |
Current usage metrics show cumulative count of Article Views (full-text article views including HTML views, PDF and ePub downloads, according to the available data) and Abstracts Views on Vision4Press platform.
Data correspond to usage on the plateform after 2015. The current usage metrics is available 48-96 hours after online publication and is updated daily on week days.
Initial download of the metrics may take a while.