Free Access
Fig. 2
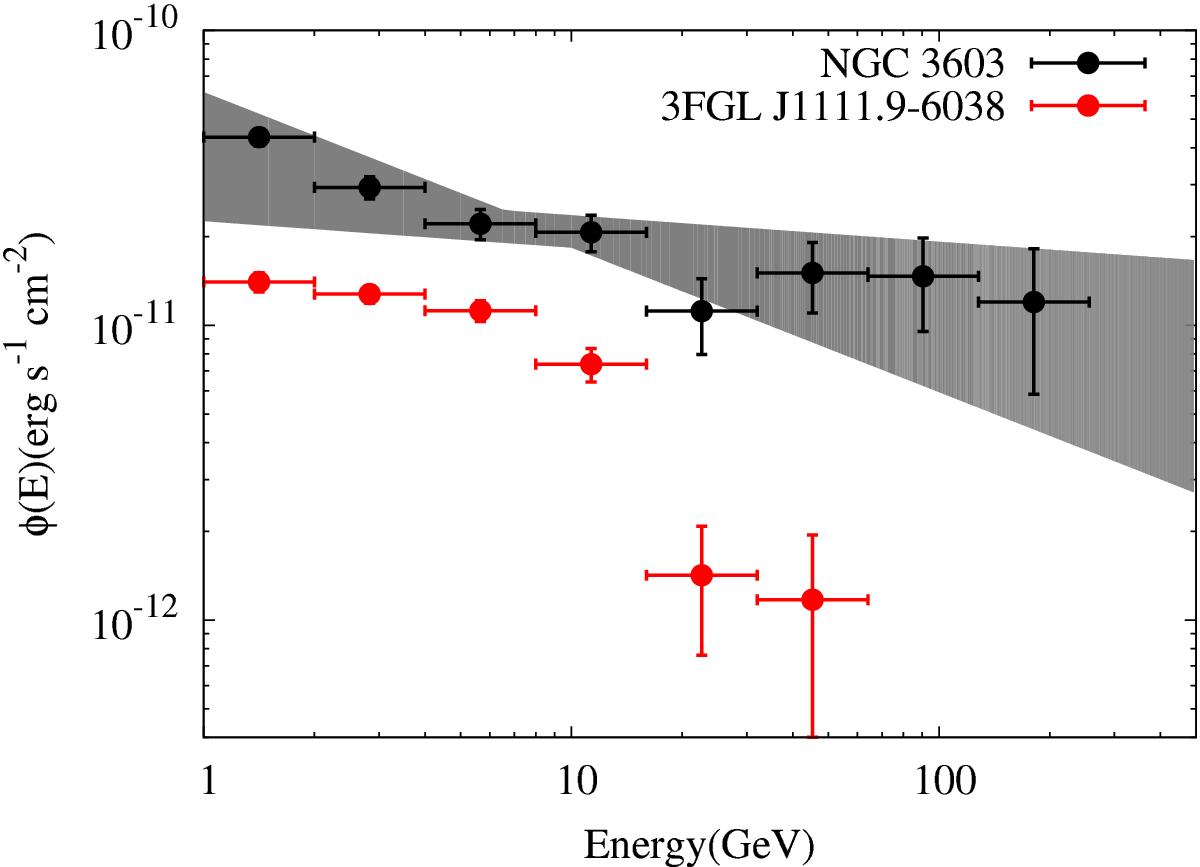
SEDs of the extended emission towards NGC 3603 and 3FGL 1111.9-6038. The grey region is the bowtie plot for the best-fit power law spectrum.
Current usage metrics show cumulative count of Article Views (full-text article views including HTML views, PDF and ePub downloads, according to the available data) and Abstracts Views on Vision4Press platform.
Data correspond to usage on the plateform after 2015. The current usage metrics is available 48-96 hours after online publication and is updated daily on week days.
Initial download of the metrics may take a while.