Free Access
Fig. 2
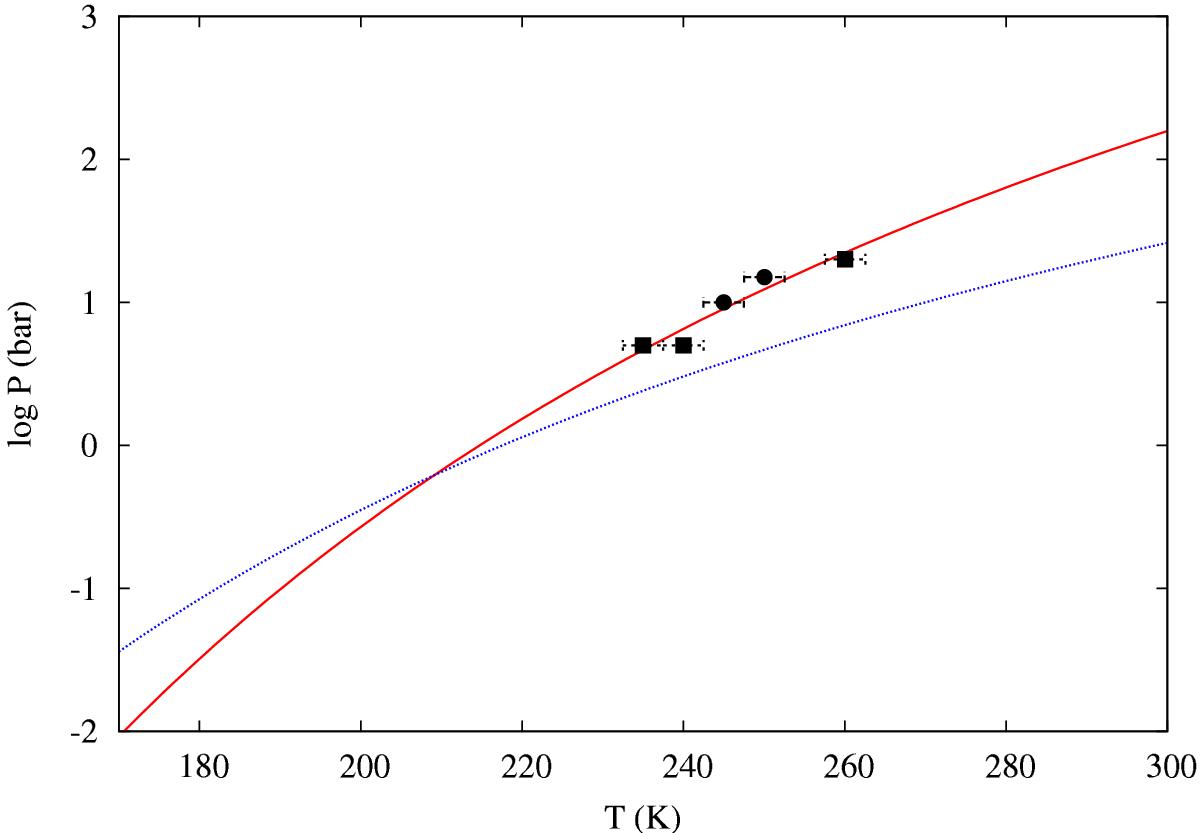
CO2 clathrate dissociation curve (red) for CO2 clathrate hydrates in MS10.5 (circles) and MS3.1 (squares) solutions, compared with the CO2 clathrate dissociation curve for CO2 clathrate hyrates in pure water (Miller 1961, blue curve).
Current usage metrics show cumulative count of Article Views (full-text article views including HTML views, PDF and ePub downloads, according to the available data) and Abstracts Views on Vision4Press platform.
Data correspond to usage on the plateform after 2015. The current usage metrics is available 48-96 hours after online publication and is updated daily on week days.
Initial download of the metrics may take a while.