| Issue |
A&A
Volume 600, April 2017
|
|
|---|---|---|
| Article Number | A84 | |
| Number of page(s) | 6 | |
| Section | Stellar structure and evolution | |
| DOI | https://doi.org/10.1051/0004-6361/201629749 | |
| Published online | 05 April 2017 | |
Evidence of a substellar companion around a very young T Tauri star⋆
1 Universidade Federal de Minas Gerais, 31270-901 Pampulha, Belo Horizonte – MG, Brasil
e-mail: This email address is being protected from spambots. You need JavaScript enabled to view it.
2 Departamento de Física e Astronomia, Faculdade de Ciências, Universidade do Porto, Rua Campo Alegre, 4169-007 Porto, Portugal
3 Instituto de Astrofísica e Ciências do Espaço, Universidade do Porto, CAUP, Rua das Estrelas, 4150-762 Porto, Portugal
4 ESO, Alonso de Cordova 3107, Casilla 19001, Vitacura, Santiago, Chile
5 Crimean Astrophysical Observatory, Russian Academy of Sciences, 298409 Nauchny, Crimea
Received: 19 September 2016
Accepted: 16 December 2016
Abstract
We present results from a near-infrared multi-epoch spectroscopic campaign to detect a young low-mass companion to a T Tauri star. AS 205A is a late-type dwarf (≈K5) of ~1 M⊙ that belongs to a triple system. Independent photometric surveys discovered that AS 205A has two distinct periods (P1 = 6.78 and P2 = 24.78 days) detected in the light curve that persist over several years. Period P1 seems to be linked to the axial-rotation of the star and is caused by the presence of cool surface spots. Period P2 is correlated with the modulation in AS 205A brightness (V) and red color (V-R), consistent with a gravitating object within the accretion disk. We here derive precise near-infrared radial velocities to investigate the origin of period P2 which is predicted to correspond to a cool source in a Keplerian orbit with a semi-major axis of ~0.17 AU positioned close to the inner disk radius of 0.14 AU. The radial velocity variations of AS 205A were found to have a period of P ≈ 24.84 days and a semi-amplitude of 1.529 km s-1. This result closely resembles the P2 period in past photometric observations (P ≈ 24.78 days). The analysis of the cross-correlation function bisector has shown no correlation with the radial velocity modulations, strongly suggesting that the period is not controlled by stellar rotation. Additional activity indicators should however be explored in future surveys. Taking this into account we found that the presence of a substellar companion is the explanation that best fits the results. We derived an orbital solution for AS 205A and found evidence of a m2 sin i≃ 19.25 MJup object in an orbit with moderate eccentricity of e ≃ 0.34. If confirmed with future observations, preferably using a multiwavelength survey approach, this companion could provide interesting constraints on brown dwarf and planetary formation models.
Key words: infrared: planetary systems / stars: pre-main sequence / techniques: radial velocities / brown dwarfs / protoplanetary disks
Based on observations collected with the CRIRES spectrograph at the VLT/UT1 8.2-m Antu Telescope (ESO runs ID 385.C-0706(A) and 093.C-0400(A)) at the Paranal Observatory, Chile.
© ESO, 2017
1. Introduction
To best address the planetary formation process we should study pre-main-sequence objects (PMS) that are still enshrouded in their original environmental conditions. The age range between ~1−5 × 10⁶ yr in PMSs is particularly interesting since it is the expected moment when the physical conditions in the disk enable planetesimal growth and disk migration.
In the last few years, several young planet detection surveys have been conducted in PMS stars using different techniques, such as direct imaging (e.g., Lafrenière et al. 2010; Kraus & Ireland 2012) or radial velocity (RV) monitoring (e.g., Martín et al. 2006; Setiawan et al. 2007; Crockett et al. 2012). To deploy RV surveys on young low-mass stars (which are considerably faint, distant and affected by extinction) is, in most of cases, an arduous task. This is partly due to the presence of cool spots produced by strong stellar magnetic fields (e.g., Johns-Krull 2007; Melo 2003), and to intense stellar activity which causes RV variability of PMS objects. These effects introduce high uncertainties to the RV measurements as well as relevant modulations of spectral line profiles that can mimic the presence of substellar companions (e.g., Saar & Donahue 1997; Hatzes 2002; Figueira et al. 2010a). While spectral distortions produced by cool spots are wavelength dependent (e.g., Vrba et al. 1986; Huélamo et al. 1998; Figueira et al. 2010a), RV variations caused by the presence of a low-mass companion affect all wavelengths equally. To diagnose whether RV variability is companion- or spot-induced, RVs and cross-correlation function bisector (BIS) measurements are correlated as are measures of other activity indices (e.g., Figueira et al. 2013) in order to search for activity induced trends (see Sect. 4.2).
In the near-infrared (NIR), the effect of stellar spots is expected to be considerably weakened when compared to the optical domain (however, see Reiners et al. 2013). Furthermore, extinction of PMS stars is also significantly reduced in the NIR. For these reasons, RV studies on low-mass PMS stars can be delivered with an enhanced precision and a higher signal-to-noise ratio (S/N) in the NIR. Observations in the NIR also favor the detection of substellar companions to T Tauri stars (TTS). TTS are young solar analogs (~1−10 × 106 yr) that have spectral energy distribution (SED) emission that peaks at 1−2 μm. Classical TTSs (CTTS)s are a subclass that further display observational evidence of the presence of an accreting circumstellar disk (e.g., Bouvier et al. 2007). It is in the rich circumstellar environment of CTTSs that protoplanets are thought to coalesce and grow in size (e.g., Pollack et al. 1996). More recently, this idea has been explicitly reinforced by the findings of Donati et al. (2016), Johns-Krull et al. (2016) and Mann et al. (2016), who reported robust evidence of the existence of Jupiter- and Neptune-sized objects around young TTS (2 Myr and 5−10 Myr, respectively).
One of the most promising CTTS for protoplanetary searches is AS 205A (≈V866 Sco). It is a young (~0.5 Myr) late-type dwarf (≈K5) with mean V = 12.4 mag that belongs to a hierarchical triple system. At an angular separation of 1.3″ (≈180 AU at 140 pc) from AS 205A lies a very low-mass (K7/M0) spectroscopic binary (Ghez et al. 1993; Prato et al. 2003; Eisner et al. 2005). An extensive photometric survey by Artemenko et al. (2010) revealed two distinct and stable periods (P1 = 6.78 and P2 = 24.78 days) in the power spectrum of the light variations of AS 205A. The 24-day photometric period was also confirmed by Percy et al. (2010). The value of P1 is typical for a rotational period of a CTTS and is caused by the presence of cool surface spots. In this context, the anti-phase variations of the (U−B) color can be explained as chromospheric emission related to the cool spots. The phase diagram for P2, on the other hand, shows modulation in brightness and red colors, which indicates the presence of a cool source. Since AS 205A is about 2 mag brighter than AS 205B (Herbig & Bell 1988) in the V band it was concluded that the observed modulated signal (V = 0.25 mag) belongs to the primary or to its circumstellar environment. The mass of AS 205A, as derived from its stellar temperature and bolometric luminosity (Andrews et al. 2009), and using the recently released pre-evolutionary tracks from Baraffe et al. (2015), is expected to be close to solar (~0.9 M⊙). According to Artemenko et al. (2010), the period P2 should correspond to the Keplerian location of an unknown close companion of AS 205A which perturbed the accretion disk with density waves. The orbit was predicted to have semimajor axis of ~0.18 AU, which is close to the inner disk radius Rin = 0.14 AU, measured by IR-interferometry (Eisner et al. 2005; Andrews et al. 2009). Artemenko et al. (2010) further interpret the light variations of P2 as the effect of scattering or extinction in the disturbed disk near the dust sublimation radius.
In this work we derived precise multi-epoch NIR RVs to investigate the origin of period P2 and searched for the presence of a low-mass companion. We report here our results and briefly discuss the implications of the study.
2. Observational method and data reduction
High-resolution observations of AS 205A were conducted in the NIR, most specifically in the H-band where CTTS photospheric information can be accessed. Spectroscopic observations were carried out in good seeing conditions (~0.8′′) between Apr. 22, 2010, and May 1, 2014, using CRIRES, the NIR high-resolution spectrograph mounted on the UT1 telescope at Paranal Observatory (ESO). AS 205A was visited eight times during this period. Spectra were collected using the 4096 × 512 pixel Aladdin III detectors and a 0.2′′ slit which delivered a R ~ 100 000 around 1598.0 nm (CRIRES setup 36). This particular setting was chosen because we could benefit from the CO2 telluric atmospheric lines as simultaneous wavelength calibrators (Huélamo et al. 2008; Figueira et al. 2010c) to derive precise RVs. Previous studies have indeed shown that telluric lines are steady RV zero-point tracers (Figueira et al. 2010b) that display a long-term stability and, for this reason, can deliver RVs with a precision down to 5−10 ms-1. Final data were acquired in 2 AB nodding cycles with an average S/N ~ 20 per pixel and an expected final precision of around 30 ms-1, sufficient, according to our simulations, to spot an object of a few to several Jupiter masses at the estimated photometric period of 24.78 days.
In addition to the AS 205A data, we also collected spectra of telluric standard stars (featureless early-type B stars) obtained with similar airmass and instrumental setup to AS 205A. All observations were taken back-to-back with a RV standard HD 192310 (K2V) of similar spectral type to examine the precision of our RV measurements along the time span of our survey.
Reduction was performed using an optimized IRAF-based pipeline (see Viana Almeida et al. 2012, for more details). In summary, all spectra were nonlinearity-corrected, dark-current subtracted, flat-fielded, sky-subtracted (through subtraction of opposing nodded spectra) and optimally extracted using the Horne (1986) algorithm. Owing to the blending of telluric and stellar lines in the final spectra, we also performed telluric removal by dividing each extracted spectrum by the spectrum of telluric standards stars.
Wavelength calibration was performed using telluric absorption lines (see e.g., Figueira et al. 2010c; Bailey et al. 2012). Laboratory wavelength zero-points of each telluric spectral line were collected from the HITRAN database (Rothman & Gordon 2009). The RVs in this study were derived using the Figueira et al. (2010c) pipeline and its adapted version to young stars developed by Viana Almeida et al. (2012). Both versions of the pipeline are based on a two-dimensional (2D) cross-correlation function (CCF) inspired by TODCOR (Mazeh & Zucker 1992). They were specifically built to derive the RV of an object relative to the zero-point established by the telluric lines.
To determine the barycentric RVs we cross-correlated each nodded spectrum against the spectra supplied by the NIR PHOENIX synthetic database (Husser et al. 2013) and against the spectra of HD 192310 observed on the same date. Two-dimensional CCFs were fitted using Gaussian function profiles. Wavelength solutions, barycentric Julian dates and RVs were then adjusted to the center of mass of the solar system using the Bretagnon & Francou (1988) ephemerids.
3. Analysis
3.1. Rotation and stellar models
To obtain the best-fitting template for cross-correlation and determine the projected equatorial velocity (v sin i) of the target we used the effective temperature/SpT scales of Luhman et al. (1998) to select a subset of PHOENIX models compatible with the photospheric properties of AS 205A. From the PHOENIX database we collected models with effective temperatures (Teff) ranging from 4100 to 4700 K, surface gravities (log g) between 3.5 and 4.0 (typical values found in TTS), and metallicities ([Fe/H]) ranging from −0.5 to 0.5 dex. The abundances of α elements were considered solar.
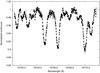 |
Fig. 1 Overplot of a stellar synthetic spectra (solid line) convolved with a v sin i of 11 km s-1 on a spectrum of AS 205A (dots). Data shown were smoothed for clarity, continuum normalized and Doppler corrected to the rest wavelength. |
We then used the gauss task from the IRAF package to degrade the resolution of the synthetic models (R ~ 500 000) in order to match that of our observations. Using a stellar rotation broadening kernel, we applied v sin i, which ranged from 6 to 20 km s-1, to the models creating a wider grid of models. We finally used a routine to interpolate through the models to find the model that minimized the chi-square (χ2) statistics and best adjusted the spectrum of AS 205A. Figure 1 shows one of the best-fit models. The final stellar parameters of our best model were Teff = 4300 K, log g = 3.5 cm s-2, [ Fe/H ] = 0.0 dex, and v sin i = 11 km s-1.
Keeping these parameters in mind, if we assume a TTS radius of 3.7 R⊙ (as provided in Andrews et al. 2010) and a system inclination of ~23.6° (given by Artemenko et al. 2012) we calculate a rotational period of P ~ 6.81 days, which is in close agreement with previous results for P1 from Artemenko et al. (2012). Curiously, the v sin i found by iteratively fitting the models is also close to the estimates used in Artemenko’s publication. It can be seen that the rotational period is clearly not of the order of the period P2 of 24.78 days encountered in the studies of Artemenko et al. (2010) and Percy et al. (2010). The apparent disparity between the two periods may seem to reinforce the idea that P2 is of companion origin and not rotationally driven, but a possible relation between P1 and 4 × P2 cannot be completely ruled out and should be investigated further in the future with a larger data set.
3.2. Radial velocities
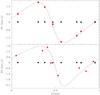 |
Fig. 2 Upper panel: RV measurements of AS 205A vs. orbital phase in Julian days with an orbital period of 24.84 days. Lower panel: same but using an orbital period of 24.78 days. Overlayed are the best-fitting Keplerian curves for each period. Black crosses close to the x-axis represent RV data from HD 192310. |
The RV measurements for each date are shown in Table 1 and plotted in Fig. 2. They are the result of the correlation of the spectral information sampled in Detectors 1, 2, and 4 of the selected CRIRES setup (containing ~15 absorption lines). Final RV uncertainties were calculated dividing the rms of each RV measurement by the square root of the number of independent exposures acquired in each date. The average error bar of the data is ~85 ms-1. The reason for this large value is essentially due to the increased level of blending of stellar and telluric lines in some of the spectra. Telluric removal in these cases is less efficient and is known to decrease the S/N of the final spectra, hence the final precision of the measurements.
Barycentric Julian dates of each nodded image, derived radial velocities and final dispersion for each date AS 205A was observed.
As mentioned before, in order to check for possible drifts in the long-term RV measurements obtained using our methodology, we retrieved RVs of a control star (HD 192310) over the time span of the study. In order to keep the same intrumental profile and reproduce the same observation conditions as in our scientific target, spectra of HD 192310 were observed back-to-back with AS 205A. Pepe et al. (2011), using high-resolution spectroscopy, published the Keplerian solutions of two orbiting planets around HD 192310. The dispersion of their RV measurements, however, had a rms of only 2.6 ms-1 over a 6.5 yr interval. Our own study detected variations in the HD 192310 RV profile with a standard deviation of ≤11 ms-1 over 4 yr of observations. Although it was beyond our detection limit we tried nevertheless to adjust the Keplerian solutions of Pepe et al. (2011) to the variations observed. The lack of consistent fits implied that the dispersion in our RV data was instead associated with the internal uncertainty of our method.
For the sake of clarity, we plot the RV measurements of HD 192310 along with those of AS 205A in Fig. 2. As we can see in this figure, the RV variations of HD 192310 over the entire study are comparatively small, providing solid evidence that observational uncertainties are not at the origin of the RV variations observed in the classical T Tauri stars. The RVs of HD 192310 seem therefore to confirm the stability and precision of the results obtained for AS 205A.
4. Discussion
4.1. Preliminary orbital parameters
Using the RVs from Table 1 we found preliminary Keplerian orbital solutions for the suggested companion. For these calculations we considered a primary mass as estimated from the recently released pre-evolutionary tracks of Baraffe et al. (2015) which present significant improvements over older tracks commonly employed in previous studies on AS 205A, such as those from Siess et al. (2000). We used the Systemic code1 to fit a Keplerian solution to the RV measurements. To find the best orbital parameters, first we fixed the Period at 24.78 days and the eccentricity e at null value while letting all the other parameters converge.
Orbital parameters for the substellar companion.
As soon as we obtained preliminary approximations for the systemic velocity Vsys, longitude of periastron ω and m2 sin i, we fine-tuned the results by letting all the orbital parameters converge simultaneously. In Fig. 2 we present the best Keplerian curves for photometric period P2 from Artemenko et al. (2010) and the period that best-fitted our RV data. The overall rms and the reduced chi-quare ( ) of the solution using a period of 24.78 days were of 421 ms-1 and 66.1, respectively. Conversely, when minimizing the rms of the fit, after some iterations, we obtain a period of 24.84 days with a much lower rms of 73.4 ms-1 and a of 1.07. This of the P ~ 24.84 day solution found for the RV data suggests a good fit to the data. Therefore, it seems that this period better explains the results. In Table 2 we display the orbital elements for the 24.84 day period final fit. The uncertainties depicted are confidence intervals provided by the bootstrap method. We resampled the original data set 100 000 times and fitted a Keplerian solution to each resampled set thereby producing distributions for each orbital parameter. We note that the degrees of freedom of the orbital solution almost equals the number of data points. This implies that we must be cautious when interpreting of the results.
4.2. Stellar activity
To determine whether variability was driven by surface cool spots, we probed the correlation of the BIS and the RVs in the CCFs obtained in each date. A clear correlation between these two quantities is expected when CCF profiles are subject to asymmetries caused by stellar spots (Queloz et al. 2001). Since young active stars are likely to have BIS that vary with time, their study can provide useful hints on the activity of AS 205A at the time of the observations. Furthermore, high stellar v sin i (11 km s-1 in the AS 205A case) are expected to favor the sensitiveness of the BIS method as an activity-induced indicator (see e.g., Santos et al. 2003). We note, however, that in the wavelength interval of our observations this correlation is expected to decrease by a factor of ~2−3 (see, e.g., models from Desort et al. 2007; Reiners et al. 2010; Ma & Ge 2012). We show in Fig. 3 the BIS plotted against the RVs obtained for AS 205A.
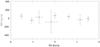 |
Fig. 3 BIS plotted against RVs of AS 205A. As we can see no correlation was detected. |
Despite the small sample size we performed a preliminary examination of the correlation between RV and BIS in our data set using different statistical diagnostics. We used a Bayesian analysis tool from Figueira et al. (2016) to compute Pearson’s correlation coefficient ε and Spearman’s rank correlation coefficient ρ and associated p-values (for more details on the method see the above publication). The Pearson’s coefficient, which measures the strength of the linear association between the two variables, was found to be −0.171 with a 0.686 two-sided p-value and the Spearman’s rank coefficient, which characterizes their monotonic relationship, was found to be approximately −0.071 with a 0.867 two-sided p-value. Both results seem to suggest that there is no statistical correlation between the distributions of the two quantities. These results led us to conclude that, at least in the NIR, the derived RVs are not correlated with BIS, hence, most probably they are not driven by stellar activity.
In the optical domain, however, past RV measurements may imply the influence of cool spots in the shape of the CCFs. Melo (2003) derived six optical RVs (⟨ σ ⟩ ~ 450 ms-1) for AS 205A using the CORALIE spectograph and reported clear RV variations on the order of 4.34 km s-1. Strikingly, this variability is comparable in order of magnitude to our own RV variations. We note, however, that one of its AS 205A CCFs (shown in Fig. 5 of Melo 2003) displayed an abnormal deformation which the author interpreted as a possible spectroscopic stellar companion. We suspect that this CCF deformation may have been caused, in part, by stellar activity even though visual inspection of its CCF seems to rule out this explanation.
Future studies should consider further testing of the effects of stellar activity and, more specifically, of rotational harmonics in the RV measurements. Harmonics are expected to affect RVs when rotational modulation of light by stellar spots occurs (see, e.g., Boisse et al. 2011). We made a preliminary test of the presence of such rotational harmonics in our data (using the rotational period calculated in Sect. 3.1.) by fitting sinusoidal functions to the residuals of the Keplerian fits shown in Fig. 2. We were unable, however, to find any coherent signs of the first three rotational harmonics (Prot/2, Prot/3, Prot/4) which could be imprinted in the RV jittering amplitudes. This result and the goodness of the fit of the adjusted Keplerian solution using P = 24.84 days increases our confidence that the results presented do not depend on stellar spot modulation. But to further explore these effects we need a better sampling of the RV curve with a higher number of data points. This kind of study would certainly improve the orbital charaterization of the reported substellar companion.
4.3. New perspective on the AS 205A system
Following the results presented here and the results from Artemenko et al. (2010), we suggest the existence of a low-mass companion to AS 205A. We propose that observational evidence of this low-mass companion in previous campaigns could have been hindered by the prolific IR emission observed in AS 205A.
Assuming that the orbit of the planet is aligned with the stellar rotation and that the inclination of the system is between ~25° (Andrews et al. 2010; Artemenko et al. 2012; Pontoppidan et al. 2011) and ~15°, as the study of Salyk et al. (2014) suggests, then the absolute mass range of the proposed substellar companion would be between ~45.6 and 74.3 MJup. This mass range suggests an upper and lower limit in Teff of around ~2200 K and 1500 K (see, e.g., Kirkpatrick 2005; Rice et al. 2010), respectively. In this temperature range the object would fall into the temperature-mass domain of ultracool dwarfs or very late-type M stars. Since the peak emission of such objects is located in the NIR range, close to 1.0 μm (Cushing et al. 2006; Sarro et al. 2013), its SED could thus be masked by the strong circumstellar IR emission of AS 205A (see, e.g., Andrews et al. 2010). Ideally, new dedicated spectroscopic observations, both high-resolution and high S/N, should be prepared in the near future with the aim of identifying notable spectral features of brown dwarfs or very late-type M stars that could be imprinted in the AS 205A spectrum. Given the very distinct nature of late-type M stars and brown dwarfs (see, e.g., McLean et al. 2007; Rice et al. 2010), this strategy could lead to a successful identification of the spectral type and mass regime of the substellar companion.
Recent sensitive high-resolution mm observations of AS 205A with the ALMA facility (Salyk et al. 2014) revealed an intriguing extended asymmetric profile of the 12CO (2−1) emission. Despite their best efforts, the authors could not explain this emission merely on the basis of a Keplerian gas-disk models and/ or stellar wind parametrization. Indeed, when compared with typical outflows produced in protostars (e.g., Jørgensen et al. 2007), the 12CO emission of AS 205A presents quite distinct and unique characteristics (see, e.g., Salyk et al. 2014). While some of the emission can be associated with tidal stripping from the close binary AS 205B at just 1.3″, it is unlikely that this phenomenon alone could explain the observations. Arguably, the discrepancies observed may suggest the unaccounted presence of an additional companion to AS 205A. This possibility should be explored in the future if follow-up studies confirm the existence of a close substellar object.
5. Conclusion
It is interesting to note the close agreement between the estimated photometric period P2 (~24.78 days) of Artemenko et al. (2010) and the Keplerian period obtained with our NIR spectroscopy (P ~ 24.84 days). Period P2, to the best of our knowledge, does not seem to be a rotational modulation produced by spots in the stellar surface. More RV measurements, however, are necessary in order to confirm these results. Even though unacounted phenomena such as stellar activity and/ or accretion (e.g., Bouvier et al. 2007) could have influenced the spectral profile, the high-precision attained in this study (below 70 ms-1 in most of the cases) and the lack of correlation of BIS and RVs variations provide strong support for our companion interpretation. The substellar companion hypothesis is, to the best of our knowledge, the most robust explanation for the results obtained.
The confirmation of a substellar companion at the border of the inner gap of the protoplanetary disk at such an early time (~0.5−1 Myr) could provide interesting constraints on brown dwarf and planet formation theories and on the process in which planets migrate within the circumstellar disk. The AS 205A system remains an important target to engage new observations in the near future.
Acknowledgments
P.V.A. acknowledges the support from Comissão Nacional de Pesquisa (CNPq) and the Brazilian National Council of Scientific and Technologic Development, in the form of a grant PDJ with reference 160111/2012-9. This work was supported by Fundação para a Ciência e a Tecnologia (FCT) within projects reference PTDC/FIS-AST/1526/2014 (POCI-01-0145-FEDER-016886) and UID/FIS/04434/2013 (POCI-01-0145-FEDER-007672). PF and NCS acknowledge support by Fundação para a Ciência e a Tecnologia (FCT) through Investigador FCT contracts of reference IF/01037/2013 and IF/00169/2012, respectively, and POPH/FSE (EC) by FEDER funding through the program “Programa Operacional de Factores de Competitividade − COMPETE”. P.F. also acknowledges support from Fundação para a Ciência e a Tecnologia (FCT) in the form of an exploratory project of reference IF/01037/2013CP1191/CT0001.
References
- Andrews, S. M., Wilner, D. J., Hughes, A. M., Qi, C., & Dullemond, C. P. 2009, ApJ, 700, 1502 [NASA ADS] [CrossRef] [Google Scholar]
- Andrews, S. M., Wilner, D. J., Hughes, A. M., Qi, C., & Dullemond, C. P. 2010, ApJ, 723, 1241 [NASA ADS] [CrossRef] [Google Scholar]
- Artemenko, S. A., Grankin, K. N., & Petrov, P. P. 2010, Astron. Rep., 54, 163 [NASA ADS] [CrossRef] [Google Scholar]
- Artemenko, S. A., Grankin, K. N., & Petrov, P. P. 2012, Astron. Lett., 38, 783 [NASA ADS] [CrossRef] [Google Scholar]
- Bailey, III, J. I., White, R. J., Blake, C. H., et al. 2012, ApJ, 749, 16 [NASA ADS] [CrossRef] [Google Scholar]
- Baraffe, I., Homeier, D., Allard, F., & Chabrier, G. 2015, A&A, 577, A42 [NASA ADS] [CrossRef] [EDP Sciences] [Google Scholar]
- Boisse, I., Bouchy, F., Hébrard, G., et al. 2011, A&A, 528, A4 [NASA ADS] [CrossRef] [EDP Sciences] [Google Scholar]
- Bouvier, J., Alencar, S. H. P., Harries, T. J., Johns-Krull, C. M., & Romanova, M. M. 2007, Protostars and Planets V, 479 [Google Scholar]
- Bretagnon, P., & Francou, G. 1988, A&A, 202, 309 [Google Scholar]
- Crockett, C. J., Mahmud, N. I., Prato, L., et al. 2012, ApJ, 761, 164 [NASA ADS] [CrossRef] [Google Scholar]
- Cushing, M. C., Roellig, T. L., Marley, M. S., et al. 2006, ApJ, 648, 614 [NASA ADS] [CrossRef] [Google Scholar]
- Desort, M., Lagrange, A.-M., Galland, F., Udry, S., & Mayor, M. 2007, A&A, 473, 983 [NASA ADS] [CrossRef] [EDP Sciences] [Google Scholar]
- Donati, J. F., Moutou, C., Malo, L., et al. 2016, Nature, 534, 662 [NASA ADS] [CrossRef] [Google Scholar]
- Eisner, J. A., Hillenbrand, L. A., White, R. J., Akeson, R. L., & Sargent, A. I. 2005, ApJ, 623, 952 [NASA ADS] [CrossRef] [Google Scholar]
- Figueira, P., Faria, J. P., Adibekyan, V. Z., Oshagh, M., & Santos, N. C. 2016, Origins of Life and Evolution of the Biosphere, 46, 385 [CrossRef] [Google Scholar]
- Figueira, P., Marmier, M., Bonfils, X., et al. 2010a, A&A, 513, L8 [NASA ADS] [CrossRef] [EDP Sciences] [Google Scholar]
- Figueira, P., Pepe, F., Lovis, C., & Mayor, M. 2010b, A&A, 515, A106 [NASA ADS] [CrossRef] [EDP Sciences] [Google Scholar]
- Figueira, P., Pepe, F., Melo, C. H. F., et al. 2010c, A&A, 511, A55 [NASA ADS] [CrossRef] [EDP Sciences] [Google Scholar]
- Figueira, P., Santos, N. C., Pepe, F., Lovis, C., & Nardetto, N. 2013, A&A, 557, A93 [NASA ADS] [CrossRef] [EDP Sciences] [Google Scholar]
- Ghez, A. M., Neugebauer, G., & Matthews, K. 1993, AJ, 106, 2005 [NASA ADS] [CrossRef] [Google Scholar]
- Hatzes, A. P. 2002, Astron. Nachr., 323, 392 [NASA ADS] [CrossRef] [Google Scholar]
- Herbig, G. H., & Bell, K. R. 1988, Third Catalog of Emission-Line Stars of the Orion Population, 90 [Google Scholar]
- Horne, K. 1986, PASP, 98, 609 [NASA ADS] [CrossRef] [EDP Sciences] [Google Scholar]
- Huélamo, N., Gómez de Castro, A. I., & Franqueira, M. 1998, in Ultraviolet Astrophysics Beyond the IUE Final Archive, eds. W. Wamsteker, R. Gonzalez Riestra, & B. Harris, ESA SP, 413, 121 [Google Scholar]
- Huélamo, N., Figueira, P., Bonfils, X., et al. 2008, A&A, 489, L9 [NASA ADS] [CrossRef] [EDP Sciences] [Google Scholar]
- Husser, T.-O., Wende-von Berg, S., Dreizler, S., et al. 2013, A&A, 553, A6 [NASA ADS] [CrossRef] [EDP Sciences] [Google Scholar]
- Johns-Krull, C. M. 2007, ApJ, 664, 975 [NASA ADS] [CrossRef] [Google Scholar]
- Johns-Krull, C. M., McLane, J. N., Prato, L., et al. 2016, ApJ, 826, 206 [NASA ADS] [CrossRef] [Google Scholar]
- Jørgensen, J. K., Bourke, T. L., Myers, P. C., et al. 2007, ApJ, 659, 479 [NASA ADS] [CrossRef] [Google Scholar]
- Kirkpatrick, J. D. 2005, ARA&A, 43, 195 [NASA ADS] [CrossRef] [Google Scholar]
- Kraus, A. L., & Ireland, M. J. 2012, ApJ, 745, 5 [NASA ADS] [CrossRef] [Google Scholar]
- Lafrenière, D., Jayawardhana, R., & van Kerkwijk, M. H. 2010, ApJ, 719, 497 [NASA ADS] [CrossRef] [Google Scholar]
- Luhman, K. L., Rieke, G. H., Lada, C. J., & Lada, E. A. 1998, ApJ, 508, 347 [NASA ADS] [CrossRef] [Google Scholar]
- Ma, B., & Ge, J. 2012, ApJ, 750, 172 [NASA ADS] [CrossRef] [Google Scholar]
- Mann, A. W., Newton, E. R., Rizzuto, A. C., et al. 2016, AJ, 152, 61 [NASA ADS] [CrossRef] [Google Scholar]
- Martín, E. L., Guenther, E., Zapatero Osorio, M. R., Bouy, H., & Wainscoat, R. 2006, ApJ, 644, L75 [NASA ADS] [CrossRef] [Google Scholar]
- Mazeh, T., & Zucker, S. 1992, in IAU Colloq. 135: Complementary Approaches to Double and Multiple Star Research, eds. H. A. McAlister, & W. I. Hartkopf,ASP Conf. Ser., 32, 164 [Google Scholar]
- McLean, I. S., Prato, L., McGovern, M. R., et al. 2007, ApJ, 658, 1217 [NASA ADS] [CrossRef] [Google Scholar]
- Melo, C. H. F. 2003, A&A, 410, 269 [NASA ADS] [CrossRef] [EDP Sciences] [Google Scholar]
- Pepe, F., Lovis, C., Ségransan, D., et al. 2011, A&A, 534, A58 [NASA ADS] [CrossRef] [EDP Sciences] [Google Scholar]
- Percy, J. R., Grynko, S., Seneviratne, R., & Herbst, W. 2010, PASP, 122, 753 [NASA ADS] [CrossRef] [Google Scholar]
- Pollack, J. B., Hubickyj, O., Bodenheimer, P., et al. 1996,Icarus, 124, 62 [Google Scholar]
- Pontoppidan, K. M., Blake, G. A., & Smette, A. 2011, ApJ, 733, 84 [NASA ADS] [CrossRef] [Google Scholar]
- Prato, L., Greene, T. P., & Simon, M. 2003, ApJ, 584, 853 [NASA ADS] [CrossRef] [Google Scholar]
- Queloz, D., Henry, G. W., Sivan, J. P., et al. 2001, A&A, 379, 279 [NASA ADS] [CrossRef] [EDP Sciences] [Google Scholar]
- Reiners, A., Bean, J. L., Huber, K. F., et al. 2010, ApJ, 710, 432 [NASA ADS] [CrossRef] [Google Scholar]
- Reiners, A., Shulyak, D., Anglada-Escudé, G., et al. 2013, A&A, 552, A103 [NASA ADS] [CrossRef] [EDP Sciences] [Google Scholar]
- Rice, E. L., Barman, T., Mclean, I. S., Prato, L., & Kirkpatrick, J. D. 2010, ApJS, 186, 63 [NASA ADS] [CrossRef] [Google Scholar]
- Rothman, L. S., & Gordon, I. E. 2009, in 64th International Symposium On Molecular Spectroscopy, 1 [Google Scholar]
- Saar, S. H., & Donahue, R. A. 1997, ApJ, 485, 319 [NASA ADS] [CrossRef] [Google Scholar]
- Salyk, C., Pontoppidan, K., Corder, S., et al. 2014, ApJ, 792, 68 [NASA ADS] [CrossRef] [Google Scholar]
- Santos, N. C., Udry, S., Mayor, M., et al. 2003, A&A, 406, 373 [NASA ADS] [CrossRef] [EDP Sciences] [Google Scholar]
- Sarro, L. M., Berihuete, A., Carrión, C., et al. 2013, A&A, 550, A44 [NASA ADS] [CrossRef] [EDP Sciences] [Google Scholar]
- Setiawan, J., Weise, P., Henning, T., et al. 2007,ApJ, 660, L145 [Google Scholar]
- Siess, L., Dufour, E., & Forestini, M. 2000, A&A, 358, 593 [Google Scholar]
- Viana Almeida, P., Melo, C., Santos, N. C., et al. 2012, A&A, 539, A62 [NASA ADS] [CrossRef] [EDP Sciences] [Google Scholar]
- Vrba, F. J., Rydgren, A. E., Chugainov, P. F., Shakovskaia, N. I., & Zak, D. S. 1986, ApJ, 306, 199 [NASA ADS] [CrossRef] [Google Scholar]
All Tables
Barycentric Julian dates of each nodded image, derived radial velocities and final dispersion for each date AS 205A was observed.
All Figures
|
Fig. 1 Overplot of a stellar synthetic spectra (solid line) convolved with a v sin i of 11 km s-1 on a spectrum of AS 205A (dots). Data shown were smoothed for clarity, continuum normalized and Doppler corrected to the rest wavelength. |
| In the text | |
|
Fig. 2 Upper panel: RV measurements of AS 205A vs. orbital phase in Julian days with an orbital period of 24.84 days. Lower panel: same but using an orbital period of 24.78 days. Overlayed are the best-fitting Keplerian curves for each period. Black crosses close to the x-axis represent RV data from HD 192310. |
| In the text | |
|
Fig. 3 BIS plotted against RVs of AS 205A. As we can see no correlation was detected. |
| In the text | |
Current usage metrics show cumulative count of Article Views (full-text article views including HTML views, PDF and ePub downloads, according to the available data) and Abstracts Views on Vision4Press platform.
Data correspond to usage on the plateform after 2015. The current usage metrics is available 48-96 hours after online publication and is updated daily on week days.
Initial download of the metrics may take a while.