Fig. 14
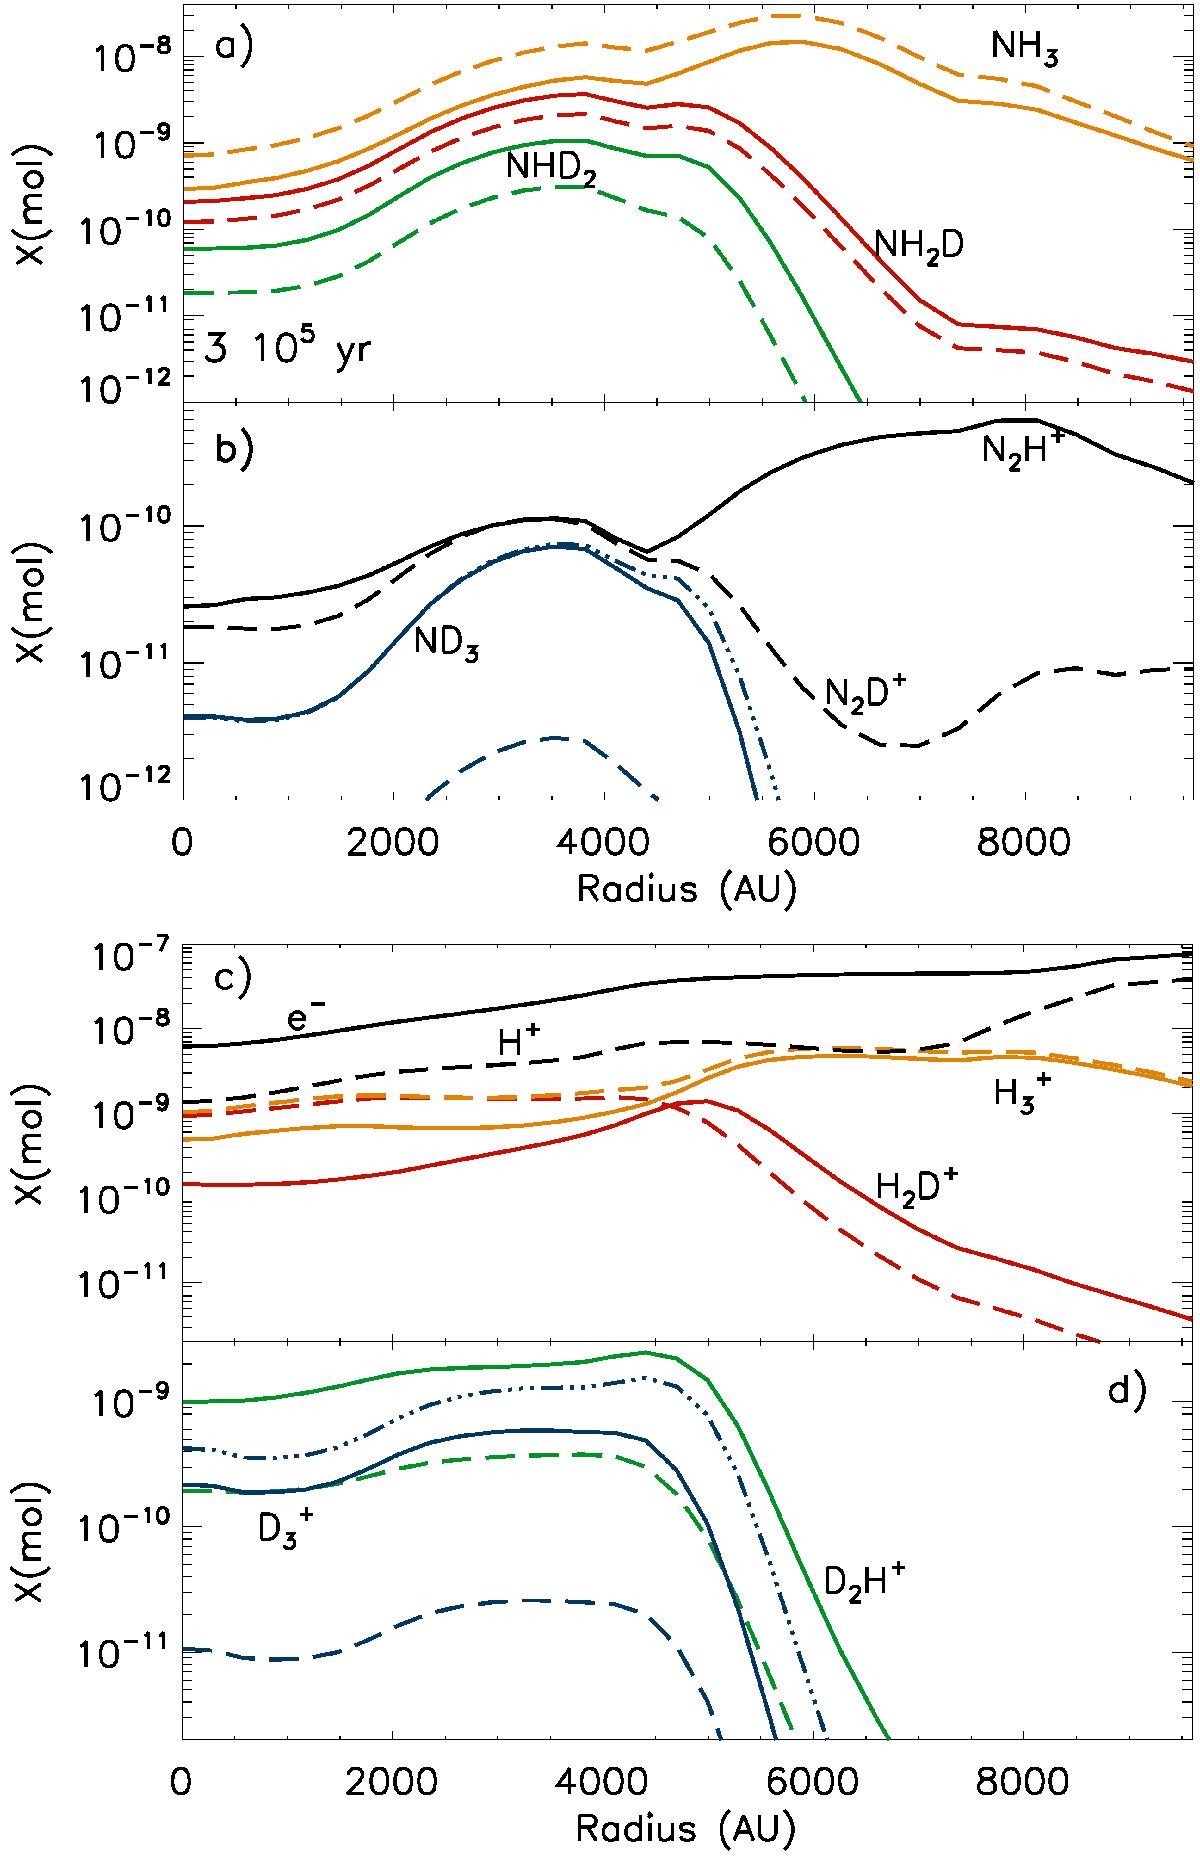
Fractional abundances of selected species as functions of the radial distance from the core centre at the time 3 × 10⁵ yr from the beginning of the simulation. The abundances of ortho species are drawn with solid lines, and those of para species are drawn with dashed lines. The abundances of meta species (ND3 and ![]() ) are indicated with dash-dotted curves.
) are indicated with dash-dotted curves.
Current usage metrics show cumulative count of Article Views (full-text article views including HTML views, PDF and ePub downloads, according to the available data) and Abstracts Views on Vision4Press platform.
Data correspond to usage on the plateform after 2015. The current usage metrics is available 48-96 hours after online publication and is updated daily on week days.
Initial download of the metrics may take a while.