| Issue |
A&A
Volume 600, April 2017
|
|
|---|---|---|
| Article Number | A110 | |
| Number of page(s) | 11 | |
| Section | Catalogs and data | |
| DOI | https://doi.org/10.1051/0004-6361/201527963 | |
| Published online | 10 April 2017 | |
The VIMOS Ultra Deep Survey first data release: Spectra and spectroscopic redshifts of 698 objects up to zspec ~ 6 in CANDELS⋆,⋆⋆
1 Aix Marseille Univ., CNRS, LAM, Laboratoire d’Astrophysique de Marseille, Marseille, France
2 Geneva Observatory, University of Geneva, ch. des Maillettes 51, 1290 Versoix, Switzerland
3 Institut de Recherche en Astrophysique et Planétologie – IRAP, CNRS, Université de Toulouse, UPS-OMP, 14 avenue E. Belin, 31400 Toulouse, France
4 INAF–Osservatorio Astronomico di Bologna, via Ranzani 1, 40127 Bologna, Italy
5 Instituto de Fisica y Astronomía, Facultad de Ciencias, Universidad de Valparaíso, Gran Bretaña 1111, Playa Ancha, Valparaíso, Chile
6 INAF–IASF Milano, via Bassini 15, 20133 Milano, Italy
7 INAF–Osservatorio Astronomico di Roma, via di Frascati 33, 00040 Monte Porzio Catone, Italy
8 University of Bologna, Department of Physics and Astronomy (DIFA), V.le Berti Pichat, 6/2 – 40127 Bologna, Italy
9 Astronomy Department, University of Massachusetts, Amherst, MA 01003, USA
10 Department of Astronomy, University of Geneva ch. d’Écogia 16, 1290 Versoix, Switzerland
11 INAF–IASF Bologna, via Gobetti 101, 40129 Bologna, Italy
12 Infrared Processing and Analysis Center, California Institute for Technology, Pasadena, CA 91125, USA
13 Institut d’Astrophysique de Paris, UMR 7095 CNRS, Université Pierre et Marie Curie, 98bis boulevard Arago, 75014 Paris, France
14 SUPA, Institute for Astronomy, University of Edinburgh, Royal Observatory, Edinburgh, EH9 3HJ, UK
15 Space Telescope Science Institute, 3700 San Martin Drive, Baltimore, MD 21218, USA
16 Centro de Estudios de Física del Cosmos de Aragón, 44001 Teruel, Spain
17 Max-Planck-Institut für Extraterrestrische Physik, Postfach 1312, 85741 Garching bei München, Germany
18 Cahill Center for Astronomy and Astrophysics, California Institute for Technology, Pasadena, CA 91125, USA
19 Research Center for Space and Cosmic Evolution, Ehime University, Bunkyo-cho 2-5, 790-8577 Matsuyama, Japan
20 National Centre for Nuclear Research, Astrophysics Division, Hoza 69, 00-681 Warszawa, Poland
⋆⋆⋆ Corresponding author: L. A. M. Tasca, e-mail: lidia.tasca@lam.fr
Received: 15 December 2015
Accepted: 26 May 2016
This paper describes the first data release (DR1) of the VIMOS Ultra Deep Survey (VUDS). The VUDS-DR1 is the release of all low-resolution spectroscopic data obtained in 276.9 arcmin2 of the CANDELS-COSMOS and CANDELS-ECDFS survey areas, including accurate spectroscopic redshifts zspec and individual spectra obtained with VIMOS on the ESO-VLT. A total of 698 objects have a measured redshift, with 677 galaxies, two type-I AGN, and a small number of 19 contaminating stars. The targets of the spectroscopic survey are selected primarily on the basis of their photometric redshifts to ensure a broad population coverage. About 500 galaxies have zspec > 2, 48of which have zspec > 4; the highest reliable redshifts reach beyond zspec = 6. This data set approximately doubles the number of galaxies with spectroscopic redshifts at z > 3 in these fields. We discuss the general properties of the VUDS–DR1 sample in terms of the spectroscopic redshift distribution, the distribution of Lyman-α equivalent widths, and physical properties including stellar masses M⋆ and star formation rates derived from spectral energy distribution fitting with the knowledge of zspec. We highlight the properties of the most massive star-forming galaxies, noting the wide range in spectral properties, with Lyman-α in emission or in absorption, and in imaging properties with compact, multi-component, or pair morphologies. We present the catalogue database and data products. All VUDS-DR1 data are publicly available and can be retrieved from a dedicated query-based database. Future VUDS data releases will follow this VUDS-DR1 to give access to the spectra and associated measurement of ~8000 objects in the full ~1 square degree of the VUDS survey.
Key words: galaxies: distances and redshifts / galaxies: high-redshift / cosmology: observations / surveys / catalogs
© ESO, 2017
1. Introduction
Deep uniformly targeted galaxy surveys are reliably uncovering the average properties of distant galaxy populations, a primary source of information for consolidating a galaxy formation and evolution scenario. Spectroscopic surveys play a key role as they provide accurate redshifts together with a wealth of spectral properties including continuum, emission, or absorption line features and indexes, which allow the physical properties of galaxies to be fully characterized. An important goal of these surveys is to provide robust properties of galaxy populations and their distributions around mean values from volume-complete samples, and also enable serendipitous discoveries and studies of rare populations.
A number of spectroscopic galaxy surveys have been performed in the past years, reaching increasingly higher redshifts and larger volumes. The local Universe is accurately surveyed by the staged Sloan Digital Sky Survey (SDSS) with more than a million galaxies observed at redshifts z ~ 0.1−0.7, as presented in the latest DR12 data release (Alam et al. 2015; Reid et al. 2016). At redshifts ~ 1 several spectroscopic surveys have sampled large volumes of the Universe with ~10 000 to ~100 000 galaxies – VVDS-Wide (Le Fèvre et al. 2005, 2013), DEEP2 (Davis et al. 2003), zCOSMOS (Lilly et al. 2007), VIPERS (Guzzo et al. 2014) – and have provided a reliable description of the galaxy properties in relation to their local environment. At redshifts z> 2 spectroscopic surveys have been more limited in scope with several thousand galaxies identified at z ~ 2−4 (Steidel et al. 2003; Bielby et al. 2011; Le Fèvre et al. 2013; Kriek et al. 2015; Momcheva et al. 2016), and only a few hundred at z > 4 (Vanzella et al. 2009; Stark et al. 2010; Le Fèvre et al. 2013; Pentericci et al. 2014). At these high redshifts the main reference samples discussed in the literature are mostly based on photometric redshift estimates obtained from SED fitting of a set of broad- and medium-band filters (e.g. Ilbert et al. 2006, 2009, 2010, 2013), are selected using the Lyman-break technique (e.g. Bouwens et al. 2015), or result from the identification of excess flux in narrow-band filters selecting high-z Lyman-α emitters (e.g. Rhoads et al. 2003; Ouchi et al. 2008).
Data releases from spectroscopic surveys are a fundamental step to provide access to a documented data set for a wide community. They enable a wide range of science investigations and provide a basis on which to establish a galaxy evolution scenario that needs to be accurately reproduced by theoretical predictions and numerical simulations. The availability of a documented reference for such data releases greatly aids this process. The galaxy samples accessed from data releases provide an observational reference upon which our view of the Universe is built. The SDSS has produced 12 data releases (DR12; Alam et al. 2015; Reid et al. 2016), and data release papers can be found for most major spectroscopic surveys including VVDS (Le Fèvre et al. 2013), DEEP2 (Newman et al. 2013), zCOSMOS–bright (Lilly et al. 2009), and VIPERS (Garilli et al. 2014). The interactions of users with large data sets are easily facilitated by the availability of databases, where query-based interfaces allow advanced data mining.
In this paper we present the first data release (DR1) of the VIMOS Ultra Deep Survey (VUDS). The VUDS was conceived to alleviate some of the limitations related to photometric samples by assembling a large sample of galaxies with spectroscopic redshifts up to some of the highest redshifts that can be reached with an 8 m class telescope (Le Fèvre et al. 2015). The primary goal of VUDS is to provide an accurate view of star-forming galaxies in the distant Universe at redshifts z> 2 and up to z ~ 6, as seen from a UV rest-frame perspective. With a large sample assembled over a large volume and star-forming galaxies dominating galaxy counts, it becomes possible to build a robust statistical description of the galaxy population at a key time in galaxy evolution, leading to an improved understanding of galaxy assembly at early cosmic times. Targets in VUDS are selected based on their photometric redshifts supplemented with colour selection and then observed with long integrations with the VIMOS multi-slit spectrograph on the VLT. With ~10 000 objects targeted in one square degree built from three separate fields to minimize cosmic variance, VUDS is currently the largest spectroscopic survey of the Universe at these high redshifts (Le Fèvre et al. 2015).
The availability to a broad community of spectra of high-redshift galaxies in well-studied extragalactic fields is essential for an improved knowledge of galaxy evolution. The VUDS–DR1 presented in this paper consists of 698 spectroscopic redshift measurements and calibrated one-dimensional spectra in 276.9 arcmin2 of the COSMOS and ECDFS areas of the CANDELS survey (Grogin et al. 2011; Koekemoer et al. 2011), as well as associated physical quantities including stellar masses and star-formation rates (SFRs). The VUDS data in the COSMOS and ECDFS regions of the HST–CANDELS survey offers the opportunity to couple the exquisite HST imaging data with the largest deep spectroscopy sample available to date.
We present the VUDS survey in CANDELS in Sect. 2, and the observations in Sect. 3. The general properties of the sample are discussed in Sect. 4. The content of the VUDS data release number 1 (VUDS–DR1) is described in Sect. 5, and some remarkable galaxies in this sample are presented in Sect. 5.4. A summary is provided in Sect. 6.
When quoting absolute quantities we use a cosmology with H0 = 70 km s-1 Mpc-1, Ω0,Λ = 0.7, and Ω0,m = 0.3. All magnitudes are given in the AB system.
2. VUDS survey in the CANDELS fields
The VIMOS Ultra Deep Survey is a spectroscopic survey targeting ≈10 000 galaxies to study galaxy evolution in the redshift range 2 < z < 6 +. We provide a summary of the survey below and the reader is referred to Le Fèvre et al. (2015) for a detailed description.
Prior to spectroscopy, targets are primarily selected from their photometric redshifts. Photometric redshifts zphot are computed using available broad-band visible and infrared photometry, as well as medium-band photometry in the COSMOS field, and fitting is performed of the spectral energy distribution (SED) using the Le Phare software (Ilbert et al. 2006). We retain as primary targets all objects at iAB ≤ 25 which satisfy zphot + 1σ ≥ 2.4, which represents more than 90% of the sample. Objects which verify Lyman-break galaxy colour selection criteria in the ugr, gri, and riz colour–colour diagrams (see criteria in Bouwens et al. 2007), and which are not already selected by their photometric redshift, are added to the target list; this concerns about 10% of the final targets.
The VIMOS field of view is 224 arcmin2 covered by four spectrograph channels with external dimensions 14 × 16 arcmin2 and a typical footprint as identified in Le Fèvre et al. (2005), with the four channels separated by sky areas without VIMOS field coverage. We define the area of this data release as the area in common between the area covered by the CANDELS H-band observations with the WFC3 camera on board the Hubble Space Telescope (Koekemoer et al. 2011) and the different VUDS pointings.
The VUDS-DR1 concerns two of the most observed extragalactic fields: COSMOS at α2000 = 10h00m28.2s, δ2000 = 02deg21′36″ and ECDFS at α2000 = 03h32m30s, δ2000 = −27deg48′00″.
The COSMOS field is rooted on the original HST–COSMOS survey covering about 2 square degrees (Scoville et al. 2007; Koekemoer et al. 2007) with a wealth of multi-wavelength optical and infrared photometry (e.g. Taniguchi et al. 2007; Ilbert et al. 2009; McCracken et al. 2012). The COSMOS field has been the focus of extensive redshift survey campaigns with the VLT (e.g. zCOSMOS survey, Lilly et al. 2007, 2009, and in prep.), Keck (P. Capak, P.I.) and Subaru (Silverman et al. 2015). In the 163.4 arcmin2 CANDELS area of the COSMOS field, about 1000 galaxies have spectroscopic redshifts from the literature prior to VUDS, mainly at low redshifts but including about 300 galaxies with 2 < z < 3.
The ECDFS covers 30 × 30 arcmin2 and has been the target of a number of spectroscopic observations at the VLT (e.g. Le Fèvre et al. 2004; Vanzella et al. 2008; Balestra et al. 2010) as well as Magellan (Cooper et al. 2012), totalling over 7000 spectroscopic redshifts at various depths and in various redshift ranges. In the CANDELS 113.5 arcmin2 area of the ECDFS about 2400 spectroscopic redshifts are available from the literature prior to VUDS, including about 500 with z > 2.
The VUDS-DR1 presented here significantly increases the number of available spectroscopic redshifts at z > 2 in two of the most observed extragalactic fields as described below.
3. Observations
Multi-slit spectroscopy is conducted with the VIsible Multi-Object Spectrograph (VIMOS) on the ESO–VLT unit number 3 “Melipal” (Le Fèvre et al. 2003). Each VIMOS pointing is observed for about 14 h in the LRBLUE grism with a wavelength coverage from 3600 to 6700 Å, and another 14 h with the LRRED grism covering 5500 to 9350 Å. Each of the LRBLUE and LRRED observations cumulates about 40 individual exposures of ~ 20 min integrations each. To remove most of the small-scale detector pattern, the telescope is offset between each exposure to move objects along the slits with a repeated offset pattern −1.0, −0.5, 0, +0.5, +1.0 arcsecond from the nominal pointing position.
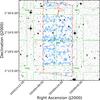 |
Fig. 1 VUDS-DR1 coverage of the CANDELS H-band F160W area in the COSMOS field. The CANDELS area is indicated by the red polygon, and the four-quadrant footprint of the four overlapping VIMOS pointings is overlaid as the green rectangles with the pointing number identified. Because of the geometry of the VUDS footprint on the sky, regions corresponding to the ~2 arcmin gap between VIMOS channels did not receive spectroscopic observations as is apparent in the lower and upper parts of the CANDELS area. The 384 galaxies with VUDS redshifts falling in the area in common between CANDELS and VUDS and part of the VUDS-DR1 are plotted as blue squares. |
VUDS pointings covering the CANDELS–ECDFS and CANDELS–COSMOS.
The VIMOS pointings relevant for this release and associated observing conditions are listed in Table 1. In the COSMOS field eight VIMOS quadrants in four separate VIMOS pointings fall in the CANDELS area (Fig. 1 and Table 1). The total area in common between VUDS and CANDELS-COSMOS is 163.43 arcmin2, excluding the regions where VIMOS did not observe (i.e. in the sky area which is blocked from view between the four channels of the VIMOS focal plane Le Fèvre et al. 2005). The CANDELS area in ECDFS was observed over seven quadrants coming from two VIMOS pointings which include 113.49 arcmin2 of the CANDELS-ECDFS area (Fig. 2 and Table 1). All observations were executed in the ESO-VLT service mode, requesting excellent observing conditions with seeing less than 1 arcsec full width at half maximum (FWHM), photometric quality, and dark time with moon distance larger than 60 degrees, if present. The process of quality control associated with the service mode observations resulted in an excellent and homogeneous set of observations with seeing in the range FWHM = 0.5−1 arcsec.
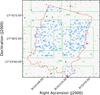 |
Fig. 2 VUDS-DR1 coverage of the CANDELS H-band F160W area in the ECDFS field. The CANDELS area is indicated by the red polygon, and the four-quadrant footprint of the two overlapping VIMOS pointings is overlaid as the green rectangles with the pointing number identified. Because of the geometry of the VUDS footprint on the sky, regions corresponding to the ~2 arcmin gap between VIMOS channels did not receive spectroscopic observations as is apparent in the lower and upper parts of the CANDELS area. The 314 galaxies with VUDS redshifts falling in the area in common between CANDELS and VUDS and part of the VUDS-DR1 are plotted as blue squares. |
Data reduction follows well-established protocols for multi-slit observations (e.g. Le Fèvre et al. 1995, 2005, 2015). Each observed slit of the multi-slit masks and each of the individual ~ 40 exposures is processed in the following way using the VIPGI environment (Scodeggio et al. 2005). First, 2D spectrograms are extracted and wavelength calibrated using He+Ar spectra, and then sky subtraction is performed at each wavelength using a low-order polynomial fit along the slit profile. The spectra are registered to the same relative position in the slit to take into account the offsets applied during the observations, and then stacked using a sigma-clipped average which removes most of the instrumental signatures. Spectra are then placed in the FK5 celestial coordinates grid. The spectrum associated with the primary target on which the slit has been positioned is identified, and other spectra traces or single emission line objects (e.g. faint Lyα emitters) are associated with photometric catalogue entries (secondary target, spectroscopic flag 2X; see Sect. 5.1) or categorized as spectroscopic emitters without photometric counterparts (flag − 2X).
Summary of VUDS redshift reliability flags.
One-dimensional spectra are then extracted using optimal weighting based on a Gaussian fit of the 1D profile of each object projected along the dispersion axis, and are sky-corrected and flux calibrated using calibrations performed at regular intervals on spectrophotometric standards. The flux calibration assumes that each observing sequence (observing block) is obtained under photometric conditions, which is generally the case for observations in service mode forced to comply to strict observations requirements. This sequence is applied to both the LRBLUE and LRRED grating observations. The LRBLUE and LRRED spectra are then joined to build the final 1D spectrum for each object covering the wavelength range 3600 to 9350 Å after scaling based on the average flux in the overlap wavelength range 5500 <λ< 6700 Å in common between the LRBLUE and LRRED. Each 1D spectrum is associated with the nearest object in (α2000,δ2000) coordinates in the parent target catalogue. A further joint visual examination of photometric images and 2D spectra is performed to sort out any ambiguity in associating a photometric image with a trace in a 2D spectrum.
All 1D and 2D spectra are visually examined to assign a redshift following a method extensively used for high-redshift galaxy surveys as described in Le Fèvre et al. (2005, 2013, 2015), Lilly et al. (2007). The method makes use of the EZ redshift measuring package (Garilli et al. 2010) which cross-correlates observed spectra with empirical galaxy, active galactic nucleus (AGN), and stellar templates.
At the end of this process each object observed has flux and wavelength calibrated 2D and 1D spectra associated with it and is assigned a spectroscopic redshift zspec and a reliability flag zflag (see Sect. 5.1 and Table 2 for a description of the spectroscopic flag system).
4. General properties of galaxies in VUDS–DR1
We provide below an outlook of the properties of galaxies in the VUDS-DR1, including the redshift distribution, Lyman-α emitters, and we compare this new sample with existing samples in the COSMOS and ECDFS fields.
4.1. Redshift distribution
The redshift distribution of the VUDS-DR1 in the CANDELS-COSMOS and CANDELS-ECDFS fields is shown in Fig. 3. The redshift distributions show a number of significant peaks as the lines of sight in each of the fields crosses over the large-scale structure distribution.
Several peaks in the N(z) distribution are associated with documented structures in the literature and support the existence of these over-densities. In the COSMOS field the two most prominent peaks in the VUDS-DR1 N(z) are at z ~ 2.45 and z ~ 2.9. The strong over-density at z ~ 2.45 was recently pointed out by Chiang et al. (2015) and identified by Casey et al. (2015) as a proto-cluster including seven star-bursting submillimeter-luminous galaxies and five AGN. In the CANDELS-COSMOS area alone we find 22 galaxies with 2.45 ≤ zspec ≤ 2.5. This appears to be a massive and complex structure comprised of two or three main components, which will be further investigated in Lemaux, et al. (in prep.). The peak at z ~ 2.9 may correspond to a structure associated with the proto-cluster identified from the VUDS data in COSMOS by Cucciati et al. (2014). The peak at z ~ 2.1 corresponds to galaxies in the vicinity of the structure at z = 2.095 reported by Yuan et al. (2014). In the ECDFS two peaks are identified beyond z = 2 at z ~ 2.9 and z ~ 3.5; the latter peak is possibly connected to the overdensity reported in Kang & Im (2009). From the redshift distributions in the CANDELS areas and the VUDS survey area it appears that VUDS samples a large number of over-dense regions as a result of the large volume sampled and target selection strategy.
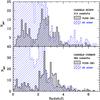 |
Fig. 3 Redshift distribution of the VUDS–DR1 in the CANDELS-COSMOS (bottom) and in the CANDELS-ECDFS (top) fields. All galaxies with a spectroscopic redshift measurement available in these two fields are presented. The light grey histograms are for VUDS-DR1 sources, while the blue diagonal shaded histograms are for measurements obtained by other surveys. |
A complete search and 3D characterization of large-scale structures in the VUDS sample will be presented elsewhere.
4.2. Lyman-α equivalent width
The equivalent width (EW) of the Lyα line was measured manually using the splot tool in the noao.onedspec package in IRAF, similarly to Tresse et al. (1999). We first put each galaxy spectrum in its rest-frame according to the spectroscopic redshift. Then, two continuum points bracketing the Lyα are manually marked and the rest-frame equivalent width is measured. The line is not fitted with a Gaussian, but the flux in the line is obtained by integrating the area encompassed by the line and the continuum. This method allows the measurement of lines with asymmetric shapes (i.e. with deviations from Gaussian profiles), which is expected to be the case for most Lyα lines. The interactive method also allows us to control by eye the level of the continuum, taking into account defects that may be present around the line measured. It does not have the objectivity of automatic measurements; however, given the sometimes complex blend between Lyα emission and Lyα absorption, it does produce reliable and accurate measurements.
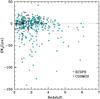 |
Fig. 4 Lyman-α rest-frame equivalent widths as a function of spectroscopic redshift for galaxies in the CANDELS-COSMOS and CANDELS-ECDFS areas of the VUDS-DR1. Negative EW values indicate Lyα in emission. Galaxies in the VUDS-DR1 sample show predominantly Lyα in absorption up to z ~ 3.5, and Lyα in emission at z> 3.5 (see Cassata et al. 2015, for the full VUDS sample). |
The distribution of rest-frame Lyman-α EW0 as a function of redshift is presented in Fig. 4. The VUDS-DR1 sample, like the VUDS sample, is dominated by galaxies with Lyα in absorption for z< 3.5 and Lyα in emission for z> 3.5.
4.3. Comparison of the VUDS-DR1 galaxy sample with previous samples in CANDELS-COSMOS and CANDELS-ECDFS
The VUDS-DR1 data release is contributing a substantial new sample of galaxies with spectroscopic redshifts, in addition to galaxies with measured redshifts already existing in the CANDELS-COSMOS and CANDELS-ECDFS fields. The distribution of spectroscopic redshifts from VUDS-DR1 in both fields shown in Fig. 3 also includes the redshift distribution from a compilation of all data we could find in the literature. From this comparison, VUDS-DR1 is contributing 379 and 216 new galaxies with spectroscopic redshifts in CANDELS-COSMOS and CANDELS-ECDFS, respectively, with a total of 595 new redshifts. A number of sources were actually observed before VUDS, and re-observed by VUDS in the random selection process.
In the CANDELS-ECDFS field there are 98 out of 314 sources that match sources in other spectroscopic surveys within 0.8′′(in the VLT-VIMOS survey by Balestra et al. 2010 and the WFC3 Grism Emission Line Redshift catalogue by Morris et al. 2015). For 68 of these 98 sources the spectroscopic measurements are in agreement within the measurement errors. The remaining 34 sources have spectroscopic redshifts that disagree. For 6 objects out of these 34 the VUDS spectroscopic redshift quality is lower than reported for other measurements and should be discarded, but for the remaining 28 sources the VUDS spectroscopy is the deepest and the redshift measurement quality is higher and should supersede other existing measurements. Of the 98 re-observed objects, 61 have a spectroscopic redshift z< 2.4 confirming that VUDS is strongly contributing to increasing the number of spectroscopic measurements in the high-redshift Universe.
In the CANDELS-COSMOS field 54 sources over 384 observed by VUDS have been previously observed by other spectroscopic surveys (the VLT-VIMOS zCOSMOS-deep survey, Lilly et al. 2007 and Keck-DEIMOS observations by Capak et al., priv. comm.). Only five of these previously observed sources are publicly available and all agree with the VUDS spectroscopic redshifts. The VUDS redshifts in COSMOS are therefore all new public entries and fully contribute to increasing the number of spectroscopic measurement available to the community.
VUDS-DR1 database parameters.
5. Description of the VUDS–DR1 content
5.1. VUDS-DR1 data
The VUDS-DR1 includes the VUDS spectroscopic data in the CANDELS-COSMOS and CANDELS-ECDFS, as well as matched photometric data and derived quantities, as described below.
The primary catalogue information concerns the VIMOS spectroscopic data. The fundamental advance provided by this release is the spectroscopic redshift zspec. These measurements result from the data reduction described in Sect. 3 (see Le Fèvre et al. 2005, 2013, 2015, for more details). From repeated observations of VUDS galaxies, as well as duplicate observations using the same configuration as in the VVDS (Le Fèvre et al. 2013), the velocity accuracy of redshift measurements is about σV = 200 km s-1. A flagging scheme is associated with each redshift measurement. Started by the Canada-France Redshift Survey (CFRS, Le Fèvre et al. 1995), this flag system indicates the reliability of the redshift being accurate based on the repeatability of the measurements on re-observed targets and does not speak to metrics of “quality” of the spectrum from which the redshift is measured, a term which may manifest itself in a variety of definitions across different surveys (see e.g. discussion in Le Fèvre et al. 2013). In addition to VUDS, this flag system, or slight variants of it, have been used by the VVDS, zCOSMOS, and VIPERS surveys (Le Fèvre et al. 2013; Lilly et al. 2007; Guzzo et al. 2014). The VUDS flag system inspired from this is described in Le Fèvre et al. (2015) and a complete list with the meaning of the spectroscopic flags in the VUDS-DR1 is given in Table 2.
Associated with the spectroscopic redshift and reliability flag, the 2D and 1D object spectra and corresponding noise are made available (in FITS format). The 2D spectra are the result of the data processing described in Sect. 3, after sky subtraction, stacking of the individual exposures, and wavelength and flux calibration. Given a 2D spectrum, we can compute sky subtraction residuals as  (1)where NRegion is the number of pixels in the sky region on one side of the object, ⟨ C ⟩ is the mean of the counts in the sky region, and Cj are the counts in pixel j at wavelength i. This computation is done on both sides of the object (resL and resR), taking into account slit borders and possible second objects in the slit. From these residuals, a mean noise spectrum is computed, the noise in the ith pixel being given by
 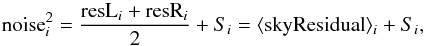 (2)where Si are the source counts at wavelength i.
The 1D spectra are produced by joining the 1D spectra extracted from the LRBLUE and LRRED 2D spectrograms, and are calibrated in wavelength and flux. To join the VIMOS blue and red grism spectra, which have slightly different spectra dispersions (5.3 and 7.5 Å/pixel), the red spectrum is re-sampled to the same dispersion as the blue one. The overlapping region between 5600 and 6700 Å is used to compute the flux normalization factor between the two spectra. The signal-to-noise ratio (S/N) of the final joined spectrum is the S/N weighted mean of the two spectra in the overlapping region. The 1D spectra are corrected for atmospheric effects (refraction and extinction) and are compared with broad-band photometry from the u-band to the i-band. The pseudo-spectrum produced by atmospheric refraction at the elevation of the observations, made available in the VIMOS spectra headers, is computed in combination with an elliptical geometrical model of each galaxy image to estimate the fraction of the light lost through the one-arcsecond wide slit (Thomas et al. 2017). This correction concerns mostly the bluer spectral data with λ ≤ 4500 Å. After this process we find that the agreement between the spectra flux and the broad-band photometry is accurate to better than 10% rms for λ ≤ 4500 Å and 5% rms for λ> 4500 Å.
5.2. Cross-match with the HST-CANDELS catalogue
Each of the VUDS catalogue entries was cross-matched to the CANDELS source list in each of the COSMOS and ECDFS fields as kindly provided by the CANDELS collaboration (Guo et al. 2013). For each VUDS target the coordinates based on the original VIMOS targeting scheme were cross-matched to the CANDELS catalogue using a matching radius of 0.5″. As a result of this process, all of the VUDS entries are associated with a CANDELS identification number. This facilitates data searches across different catalogues. When a source is resolved in the HST images with multiple components identified in the CANDELS catalogue, only the closest match to the VUDS catalogue is chosen. Therefore while a single VUDS source can have several counterparts in CANDELS, the reverse should not happen, and we estimate that this concerns 1.4% of objects for a 0.5 arcsec search radius (this would rise to 12.3% for a 1 arcsecond search radius). We note that this resolution effect may have important implications, for example in counting faint galaxies.
All spectroscopic data and parameters derived from SED fitting are available in the VUDS-DR1. We list the main parameters of interest in Table 3.
5.3. Associated physical parameters: synthetic model fitting
To derive associated physical parameters for all spectroscopic objects encompassed in VUDS-DR1, e.g. stellar masses, mean luminosity-weighted stellar ages, SFRs, and rest-frame absolute magnitudes, we utilized the package Le Phare1 (Arnouts et al. 1999; Ilbert et al. 2006, 2009).
The ten most massive galaxies with log(M⋆) > −0.204 × (z−5) + 10.15 in the VUDS-DR1.
The FUV, NUV, u⋆,B,V,g + ,r + ,i′,i + ,z + ,J,Ks, [ 3.6 ] , [ 4.5 ] photometry in the COSMOS field was drawn from a variety of surveys covering the field (Capak et al. 2007; Sanders et al. 2007; Taniguchi et al. 2007; Zamojski et al. 2007; McCracken et al. 2012). The process of PSF–homogenizing all UV/optical/ground-based near-IR images, source detection, the inclusion of the Spitzer/IRAC data, and the conversion of all magnitudes to “pseudo-total” magnitudes is described in detail in Ilbert et al. (2013). The [5.8] and [8.0] cryogenic Spitzer/IRAC channels were not included in this fitting because offsets of 1–2.5 mags were noticed relative to the best-fit templates excluding these bands for ~40% of the objects in VUDS–DR1 irrespective of redshift or model. As the original targeting for VUDS used an official COSMOS photometric catalogue (v1.7), the cross-matching of this catalogue with the photometric catalogue used for the fitting process is straightforward.
For ECDFS, in VUDS-DR1 we provide two different SED fitting results based on two different photometric catalogues. The first fitting was performed on the ground-based U,B,V,R,I,z,J,H,K MUSYC photometry and Spitzer/IRAC [ 3.6 ] , [ 4.5 ] , [ 5.8 ] , [ 8.0 ] photometry presented in Cardamone et al. (2010), which was, in turn drawn from a variety of different surveys (see Table 3 of Cardamone et al. 2010). Details of detection, PSF-homogenization, and correction of aperture magnitudes to close-to-total magnitudes is described in detail in Cardamone et al. (2010). The Cardamone et al. (2010) photometric source catalogue was used to select targets for VUDS and thus no additional astrometry mapping was needed. The second set of fitting on ECDFS was performed on the U, F435W, F606W, F775W, F814W, F850LP, F098M, F105W, F125W, F160W, Ks, [3.6], [4.5], [5.8], [8.0] mostly space-based photometry presented in Guo et al. (2013). For further details on the properties and creation of this catalogue, as well as how the CANDELS sources were matched and consistently photometered with the ancillary data, see Guo et al. (2013). VUDS–DR1 objects were mapped to the CANDELS catalogue through nearest-neighbour matching. No obvious differences were apparent between the physical parameters we derived for sources using the CANDELS photometry from those derived using MUSYC photometry; moreover, the scatter between the two sets of fit parameters was consistent with Gaussian statistics. While both photometric catalogues resulted in a large percentage of converging SED fits using Le Phare (>97% for objects with measured magnitudes), we adopt for the presentation of VUDS-DR1 here the fitting based on the MUSYC photometry as it more closely matches the depth and filter set currently used in the COSMOS fitting.
For all sources in VUDS–DR1 with a measured spectroscopic redshift, these redshifts were used as a prior for the SED–fitting process. In the fitting we employed seven different Bruzual & Charlot (2003; hereafter BC03) models, five with star formation histories (SFHs) characterized by an exponentially decaying tau model of the form ψ(t) ∝ τ-1e− t/τ and two delayed exponentially decaying tau models of the form ψ(t) ∝ τ-2te− t/τ. All templates are considered at 43 possible ages between 50 Myr and 13.5 Gyr with the constraint that the age of the model fit to a given galaxy cannot be older than the age of the Universe tH at the redshift of that galaxy. The delayed tau models are included as it has been suggested that high-redshift galaxies have SFHs which may deviate considerably from the simple exponentially decaying tau models (e.g. Maraston et al. 2010; Schaerer et al. 2013). Values of τ range from 0.1 to 30 Gyr in roughly logarithmically equal time steps and delay times are set to 1 and 3 Gyr. Each BC03 model employs a Chabrier (2003) initial mass function and two values of stellar-phase metallicity, 0.4 Z⊙ and Z⊙. Stellar extinction is allowed to vary between Es(B−V) = 0 and 0.5 in steps of 0.05, with the prescription also allowed to vary between the Calzetti et al. (2000) starburst law and a SMC-like law (Prevot et al. 1984; Arnouts et al. 2013). Several prominent nebular emission lines are also added to the templates following the methodology of Ilbert et al. (2009).
5.4. Example data products
The VUDS sample in the CANDELS areas is rich in a number of interesting objects. We mentioned several over-dense regions in Sect. 4.1. Following Tasca et al. (2014), a number of galaxy pairs are identified from the secure spectroscopic redshift measurements of each component in a pair and will be used to calculate the pair fraction at these redshifts (Le Fèvre et al., in prep.).
To illustrate the content of the VUDS-DR1, we present the ten most massive galaxies verifying a redshift-dependent stellar mass log (M⋆) > −0.204 × (z−5) + 10.15. The evolution of this mass selection is based on the evolution of the characteristic mass as measured from the stellar mass function of Ilbert et al. (2013), and our selection uses only the most reliable spectroscopic flags 3 and 4 (see Sect. 5.1 and Table 2 for a description of the spectroscopic flag system).
The properties of these ten most massive galaxies are listed in Table 4. The VUDS spectra of these galaxies are presented together with the CANDELS images in Figs. A.1 and A.2. We find massive galaxies at all redshifts from z ~ 2.5 to z ~ 5. The diversity of galaxy types at these masses is clearly illustrated in these examples with a wide range of morphologies and spectral properties. Images show both very compact objects, and extended or multiple component objects, as well as pairs possibly indicative of mergers. The spectra of these objects include galaxies with only absorption lines, as well as galaxies with strong Lyman-α emission. Their SFRs are generally high, ranging from ~ 7 to more than 100 M⊙/yr.
6. Summary
The VIMOS Ultra Deep Survey first data release (VUDS–DR1) gives full access to the low-resolution spectroscopic data for 698 sources in the CANDELS–COSMOS and CANDELS–ECDFS fields, covering a total area of 276.9 arcmin2. The most important new information provided by this release are the spectroscopic redshifts zspec and associated reliability flags, the full 1D flux and wavelength calibrated VIMOS spectra, and the Lyman-α rest-frame equivalent widths. We also release SED derived quantities at the spectroscopic redshift value, including stellar mass M⋆ and SFR. Out of the 677 galaxies identified, about 500 are at a redshift zspec> 2 and up to zspec ~ 6; there are ~ 50 with zspec> 4. The VUDS–DR1 therefore approximately doubles the number of high-redshift galaxies with spectroscopic redshifts measured at z> 3 in the CANDELS areas of the COSMOS and ECDFS fields.
All the 698 objects in the CANDELS–COSMOS and CANDELS–ECDFS are publicly released from the CESAM data center2.
Future VUDS data releases will follow this VUDS–DR1 to give complete access to the spectra and associated measurements of ~8000 objects in the full ~1 square degree of the VUDS survey, including ~100 sources at z> 3 observed with the VIMOS medium resolution grism in the CANDELS–ECDFS.
Acknowledgments
This work is supported by funding from the European Research Council Advanced Grant ERC–2010–AdG–268107–EARLY and by INAF Grants PRIN 2010, PRIN 2012 and PICS 2013. A.C., O.C., M.T., and V.S. acknowledge the grant MIUR PRIN 2010–2011. This work is based on data products made available at the CESAM data center, Laboratoire d’Astrophysique de Marseille, France.
References
- Alam, S., Albareti, F. D., Allen de Prieto, C., et al. 2015, ApJS, 219, 12 [NASA ADS] [CrossRef] [Google Scholar]
- Arnouts, S., Cristiani, S., Moscardini, L., et al. 1999, MNRAS, 310, 540 [NASA ADS] [CrossRef] [Google Scholar]
- Arnouts, S., Le Floc’h, E., Chevallard, J., et al. 2013, A&A, 558, A67 [NASA ADS] [CrossRef] [EDP Sciences] [Google Scholar]
- Balestra, I., Mainieri, V., Popesso, P., et al. 2010, A&A, 512, A12 [NASA ADS] [CrossRef] [EDP Sciences] [Google Scholar]
- Bielby, R. M., Shanks, T., Weilbacher, P. M., et al. 2011, MNRAS, 414, 2 [NASA ADS] [CrossRef] [Google Scholar]
- Bouwens, R. J., Illingworth, G. D., Franx, M., & Ford, H. 2007, ApJ, 670, 928 [NASA ADS] [CrossRef] [Google Scholar]
- Bouwens, R. J., Illingworth, G. D., Oesch, P. A., et al. 2015, ApJ, 803, 34 [Google Scholar]
- Calzetti, D., Armus, L., Bohlin, R. C., et al. 2000, ApJ, 533, 682 [NASA ADS] [CrossRef] [Google Scholar]
- Capak, P., Aussel, H., Ajiki, M., et al. 2007, ApJS, 172, 99 [NASA ADS] [CrossRef] [Google Scholar]
- Cardamone, C. N., van Dokkum, P. G., Urry, C. M., et al. 2010, ApJS, 189, 270 [NASA ADS] [CrossRef] [Google Scholar]
- Casey, C. M., Cooray, A., Capak, P., et al. 2015, ApJ, 808, L33 [NASA ADS] [CrossRef] [Google Scholar]
- Cassata, P., Tasca, L. A. M., Le Fèvre, O., et al. 2015, A&A, 573, A24 [NASA ADS] [CrossRef] [EDP Sciences] [Google Scholar]
- Chabrier, G. 2003, PASP, 115, 763 [Google Scholar]
- Chiang, Y.-K., Overzier, R. A., Gebhardt, K., et al. 2015, ApJ, 808, 37 [NASA ADS] [CrossRef] [Google Scholar]
- Cooper, M. C., Yan, R., Dickinson, M., et al. 2012, MNRAS, 425, 2116 [NASA ADS] [CrossRef] [Google Scholar]
- Cucciati, O., Zamorani, G., Lemaux, B. C., et al. 2014, A&A, 570, A16 [NASA ADS] [CrossRef] [EDP Sciences] [Google Scholar]
- Davis, M., Faber, S. M., Newman, J., et al. 2003, in Discoveries and Research Prospects from 6- to 10-m-Class Telescopes II, ed. P. Guhathakurta, SPIE Conf. Ser., 4834, 161 [Google Scholar]
- Garilli, B., Fumana, M., Franzetti, P., et al. 2010, PASP, 122, 827 [NASA ADS] [CrossRef] [Google Scholar]
- Garilli, B., Guzzo, L., Scodeggio, M., et al. 2014, A&A, 562, A23 [NASA ADS] [CrossRef] [EDP Sciences] [Google Scholar]
- Giallongo, E., Grazian, A., Fiore, F., et al. 2015, A&A, 578, A83 [NASA ADS] [CrossRef] [EDP Sciences] [Google Scholar]
- Grogin, N. A., Kocevski, D. D., Faber, S. M., et al. 2011, ApJS, 197, 35 [NASA ADS] [CrossRef] [Google Scholar]
- Guo, Y., Ferguson, H. C., Giavalisco, M., et al. 2013, ApJS, 207, 24 [NASA ADS] [CrossRef] [Google Scholar]
- Guzzo, L., Scodeggio, M., Garilli, B., et al. 2014, A&A, 566, A108 [NASA ADS] [CrossRef] [EDP Sciences] [Google Scholar]
- Ilbert, O., Arnouts, S., McCracken, H. J., et al. 2006, A&A, 457, 841 [NASA ADS] [CrossRef] [EDP Sciences] [Google Scholar]
- Ilbert, O., Capak, P., Salvato, M., et al. 2009, ApJ, 690, 1236 [NASA ADS] [CrossRef] [Google Scholar]
- Ilbert, O., Salvato, M., Le Floc’h, E., et al. 2010, ApJ, 709, 644 [NASA ADS] [CrossRef] [Google Scholar]
- Ilbert, O., McCracken, H. J., Le Fèvre, O., et al. 2013, A&A, 556, A55 [NASA ADS] [CrossRef] [EDP Sciences] [Google Scholar]
- Kang, E., & Im, M. 2009, ApJ, 691, L33 [NASA ADS] [CrossRef] [Google Scholar]
- Koekemoer, A. M., Aussel, H., Calzetti, D., et al. 2007, ApJS, 172, 196 [NASA ADS] [CrossRef] [Google Scholar]
- Koekemoer, A. M., Faber, S. M., Ferguson, H. C., et al. 2011, ApJS, 197, 36 [NASA ADS] [CrossRef] [Google Scholar]
- Kriek, M., Shapley, A. E., Reddy, N. A., et al. 2015, ApJS, 218, 15 [NASA ADS] [CrossRef] [Google Scholar]
- Le Fèvre, O., Crampton, D., Lilly, S. J., Hammer, F., & Tresse, L. 1995, ApJ, 455, 60 [NASA ADS] [CrossRef] [Google Scholar]
- Le Fèvre, O., Saisse, M., & Mancini, D. 2003, in SPIE Conf. Ser., 4841, eds. M. Iye, & A. F. M. Moorwood, 1670 [Google Scholar]
- Le Fèvre, O., Vettolani, G., Paltani, S., et al. 2004, A&A, 428, 1043 [NASA ADS] [CrossRef] [EDP Sciences] [Google Scholar]
- Le Fèvre, O., Vettolani, G., & Garilli, B. 2005, A&A, 439, 845 [NASA ADS] [CrossRef] [EDP Sciences] [Google Scholar]
- Le Fèvre, O., Cassata, P., Cucciati, O., et al. 2013, A&A, 559, A14 [NASA ADS] [CrossRef] [EDP Sciences] [Google Scholar]
- Le Fèvre, O., Tasca, L. A. M., Cassata, P., et al. 2015, A&A, 576, A79 [NASA ADS] [CrossRef] [EDP Sciences] [Google Scholar]
- Lilly, S. J., Le Fèvre, O., Renzini, A., et al. 2007, ApJS, 172, 70 [NASA ADS] [CrossRef] [Google Scholar]
- Lilly, S. J., Le Brun, V., Maier, C., et al. 2009, ApJS, 184, 218 [Google Scholar]
- Maraston, C., Pforr, J., Renzini, A., et al. 2010, MNRAS, 407, 830 [NASA ADS] [CrossRef] [Google Scholar]
- McCracken, H. J., Milvang-Jensen, B., Dunlop, J., et al. 2012, A&A, 544, A156 [NASA ADS] [CrossRef] [EDP Sciences] [Google Scholar]
- Momcheva, I. G., Brammer, G. B., van Dokkum, P. G., et al. 2016, ApJS, 225, 27 [NASA ADS] [CrossRef] [Google Scholar]
- Newman, J. A., Cooper, M. C., Davis, M., et al. 2013, ApJS, 208, 5 [Google Scholar]
- Ouchi, M., Shimasaku, K., Akiyama, M., et al. 2008, ApJS, 176, 301 [NASA ADS] [CrossRef] [Google Scholar]
- Pentericci, L., Vanzella, E., Fontana, A., et al. 2014, ApJ, 793, 113 [NASA ADS] [CrossRef] [Google Scholar]
- Prevot, M. L., Lequeux, J., Prevot, L., Maurice, E., & Rocca-Volmerange, B. 1984, A&A, 132, 389 [Google Scholar]
- Reid, B., Ho, S., Padmanabhan, N., et al. 2016, MNRAS, 455, 1553 [NASA ADS] [CrossRef] [Google Scholar]
- Rhoads, J. E., Dey, A., Malhotra, S., et al. 2003, AJ, 125, 1006 [NASA ADS] [CrossRef] [Google Scholar]
- Sanders, D. B., Salvato, M., Aussel, H., et al. 2007, ApJS, 172, 86 [Google Scholar]
- Schaerer, D., de Barros, S., & Sklias, P. 2013, A&A, 549, A4 [NASA ADS] [CrossRef] [EDP Sciences] [Google Scholar]
- Scodeggio, M., Franzetti, P., Garilli, B., et al. 2005, PASP, 117, 1284 [NASA ADS] [CrossRef] [Google Scholar]
- Scoville, N., Abraham, R. G., Aussel, H., et al. 2007, ApJS, 172, 38 [NASA ADS] [CrossRef] [Google Scholar]
- Silverman, J. D., Kashino, D., Sanders, D., et al. 2015, ApJS, 220, 12 [NASA ADS] [CrossRef] [Google Scholar]
- Stark, D. P., Ellis, R. S., Chiu, K., Ouchi, M., & Bunker, A. 2010, MNRAS, 408, 1628 [NASA ADS] [CrossRef] [Google Scholar]
- Steidel, C. C., Adelberger, K. L., Shapley, A. E., et al. 2003, ApJ, 592, 728 [NASA ADS] [CrossRef] [Google Scholar]
- Taniguchi, Y., Scoville, N., Murayama, T., et al. 2007, ApJS, 172, 9 [NASA ADS] [CrossRef] [Google Scholar]
- Tasca, L. A. M., Le Fèvre, O., López-Sanjuan, C., et al. 2014, A&A, 565, A10 [NASA ADS] [CrossRef] [EDP Sciences] [Google Scholar]
- Thomas, R., Le Fèvre, O., Le Brun, P., et al. 2017, A&A, 597, A88 [NASA ADS] [CrossRef] [EDP Sciences] [Google Scholar]
- Tresse, L., Dennefeld, M., Petitjean, P., Cristiani, S., & White, S. 1999, A&A, 346, L21 [NASA ADS] [Google Scholar]
- Vanzella, E., Cristiani, S., Dickinson, M., et al. 2008, A&A, 478, 83 [NASA ADS] [CrossRef] [EDP Sciences] [Google Scholar]
- Vanzella, E., Giavalisco, M., Dickinson, M., et al. 2009, ApJ, 695, 1163 [NASA ADS] [CrossRef] [Google Scholar]
- Yuan, T., Nanayakkara, T., Kacprzak, G. G., et al. 2014, ApJ, 795, L20 [NASA ADS] [CrossRef] [Google Scholar]
- Zamojski, M. A., Schiminovich, D., Rich, R. M., et al. 2007, ApJS, 172, 468 [NASA ADS] [CrossRef] [Google Scholar]
Appendix A: Additional figures
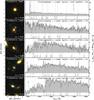 |
Fig. A.1 HST images, composite of F814W (blue), F125W (green), and F160W (red) from the CANDELS survey (left panels), and observed spectra (right panels) for the ten most massive and strongest star-forming galaxies (see text) in the VUDS-DR1. The CANDELS ID number is indicated in each of the left panels, while the ID, the spectroscopic redshift from VUDS-DR1, and the stellar mass M⋆ and SFR are indicated for each galaxy in the right panels. |
 |
Fig. A.2 HST images, composite of F814W (blue), F125W (green), and F160W (red) from the CANDELS survey (left panels), and observed spectra (right panels) for the ten most massive and strongest star-forming galaxies (see text) in the VUDS-DR1. The CANDELS ID number is indicated in each of the left panels, while the ID, the spectroscopic redshift from VUDS–DR1, and the stellar mass M⋆ and SFR are indicated for each galaxy in the right panels. |
All Tables
The ten most massive galaxies with log(M⋆) > −0.204 × (z−5) + 10.15 in the VUDS-DR1.
All Figures
|
Fig. 1 VUDS-DR1 coverage of the CANDELS H-band F160W area in the COSMOS field. The CANDELS area is indicated by the red polygon, and the four-quadrant footprint of the four overlapping VIMOS pointings is overlaid as the green rectangles with the pointing number identified. Because of the geometry of the VUDS footprint on the sky, regions corresponding to the ~2 arcmin gap between VIMOS channels did not receive spectroscopic observations as is apparent in the lower and upper parts of the CANDELS area. The 384 galaxies with VUDS redshifts falling in the area in common between CANDELS and VUDS and part of the VUDS-DR1 are plotted as blue squares. |
| In the text | |
|
Fig. 2 VUDS-DR1 coverage of the CANDELS H-band F160W area in the ECDFS field. The CANDELS area is indicated by the red polygon, and the four-quadrant footprint of the two overlapping VIMOS pointings is overlaid as the green rectangles with the pointing number identified. Because of the geometry of the VUDS footprint on the sky, regions corresponding to the ~2 arcmin gap between VIMOS channels did not receive spectroscopic observations as is apparent in the lower and upper parts of the CANDELS area. The 314 galaxies with VUDS redshifts falling in the area in common between CANDELS and VUDS and part of the VUDS-DR1 are plotted as blue squares. |
| In the text | |
|
Fig. 3 Redshift distribution of the VUDS–DR1 in the CANDELS-COSMOS (bottom) and in the CANDELS-ECDFS (top) fields. All galaxies with a spectroscopic redshift measurement available in these two fields are presented. The light grey histograms are for VUDS-DR1 sources, while the blue diagonal shaded histograms are for measurements obtained by other surveys. |
| In the text | |
|
Fig. 4 Lyman-α rest-frame equivalent widths as a function of spectroscopic redshift for galaxies in the CANDELS-COSMOS and CANDELS-ECDFS areas of the VUDS-DR1. Negative EW values indicate Lyα in emission. Galaxies in the VUDS-DR1 sample show predominantly Lyα in absorption up to z ~ 3.5, and Lyα in emission at z> 3.5 (see Cassata et al. 2015, for the full VUDS sample). |
| In the text | |
|
Fig. A.1 HST images, composite of F814W (blue), F125W (green), and F160W (red) from the CANDELS survey (left panels), and observed spectra (right panels) for the ten most massive and strongest star-forming galaxies (see text) in the VUDS-DR1. The CANDELS ID number is indicated in each of the left panels, while the ID, the spectroscopic redshift from VUDS-DR1, and the stellar mass M⋆ and SFR are indicated for each galaxy in the right panels. |
| In the text | |
|
Fig. A.2 HST images, composite of F814W (blue), F125W (green), and F160W (red) from the CANDELS survey (left panels), and observed spectra (right panels) for the ten most massive and strongest star-forming galaxies (see text) in the VUDS-DR1. The CANDELS ID number is indicated in each of the left panels, while the ID, the spectroscopic redshift from VUDS–DR1, and the stellar mass M⋆ and SFR are indicated for each galaxy in the right panels. |
| In the text | |
Current usage metrics show cumulative count of Article Views (full-text article views including HTML views, PDF and ePub downloads, according to the available data) and Abstracts Views on Vision4Press platform.
Data correspond to usage on the plateform after 2015. The current usage metrics is available 48-96 hours after online publication and is updated daily on week days.
Initial download of the metrics may take a while.