Fig. 8
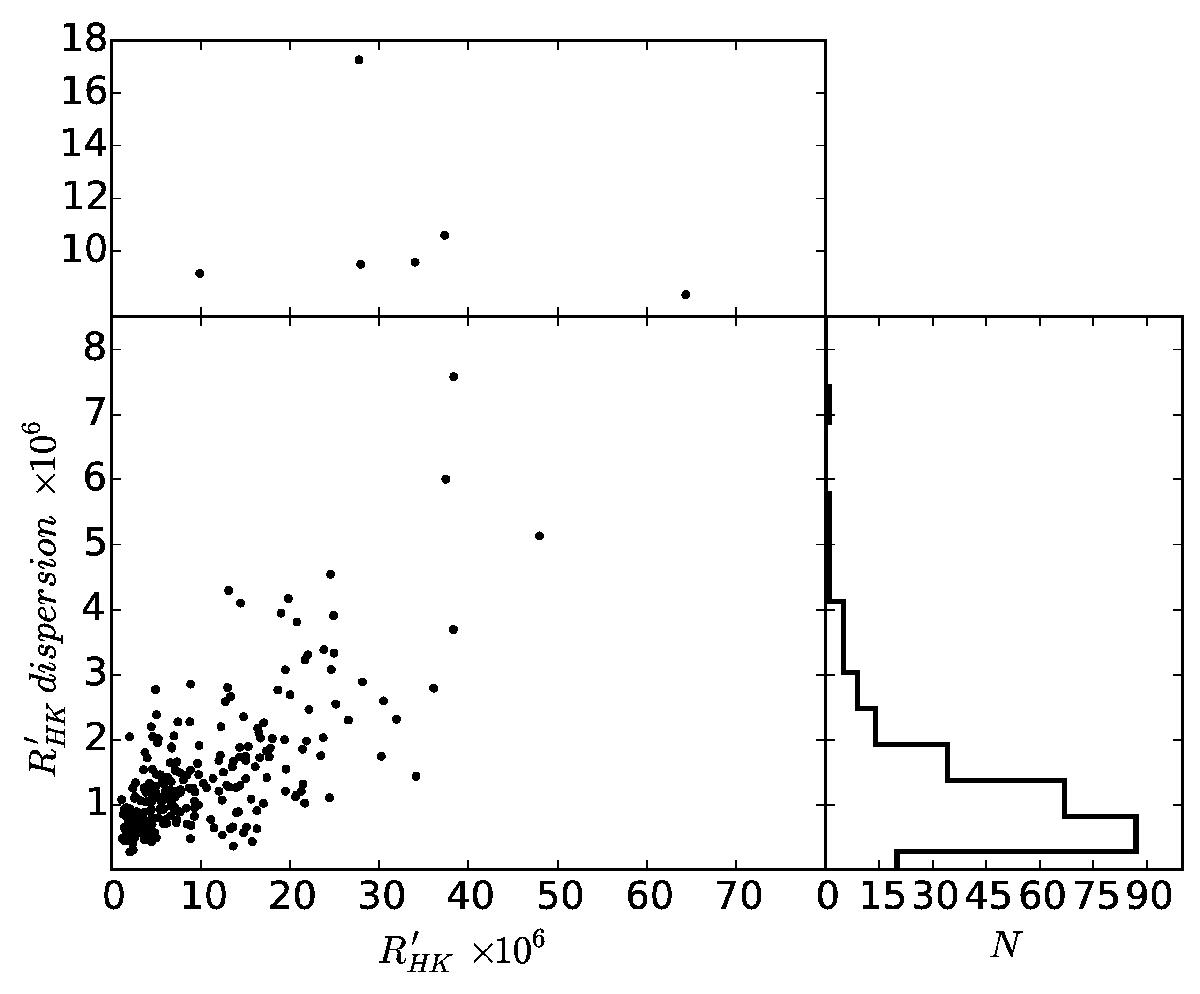
Average ![]() -index against the dispersion of its individual measurement for the 248 M dwarfs that satisfy the selection criteria described in the text. For clarity, the upper and lower panels separately display the most variable stars and the bulk of the distribution with different scales. The right-side panel shows a histogram of the
-index against the dispersion of its individual measurement for the 248 M dwarfs that satisfy the selection criteria described in the text. For clarity, the upper and lower panels separately display the most variable stars and the bulk of the distribution with different scales. The right-side panel shows a histogram of the ![]() dispersion.
dispersion.
Current usage metrics show cumulative count of Article Views (full-text article views including HTML views, PDF and ePub downloads, according to the available data) and Abstracts Views on Vision4Press platform.
Data correspond to usage on the plateform after 2015. The current usage metrics is available 48-96 hours after online publication and is updated daily on week days.
Initial download of the metrics may take a while.