Fig. 6
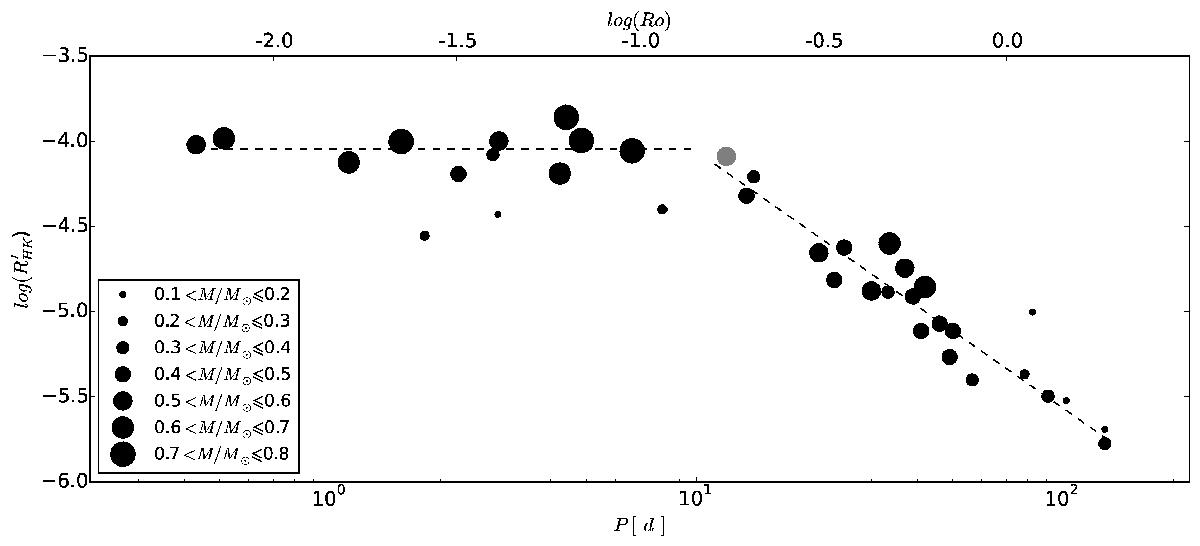
![]() against rotation period. The area of the filled circles is proportional to the stellar mass, with the gray circle representing one star that only has a photometric parallax (Lépine & Gaidos 2011) and consequently a poorly determined mass.
against rotation period. The area of the filled circles is proportional to the stellar mass, with the gray circle representing one star that only has a photometric parallax (Lépine & Gaidos 2011) and consequently a poorly determined mass. ![]() saturates for Prot< 10 d, and then decreases as an approximately linear function of log (Prot). For illustration, the upper x-axis displays the Rossby number (Ro = Prot/τc) for an assumed τc = 70 d.
saturates for Prot< 10 d, and then decreases as an approximately linear function of log (Prot). For illustration, the upper x-axis displays the Rossby number (Ro = Prot/τc) for an assumed τc = 70 d.
Current usage metrics show cumulative count of Article Views (full-text article views including HTML views, PDF and ePub downloads, according to the available data) and Abstracts Views on Vision4Press platform.
Data correspond to usage on the plateform after 2015. The current usage metrics is available 48-96 hours after online publication and is updated daily on week days.
Initial download of the metrics may take a while.