Fig. 5
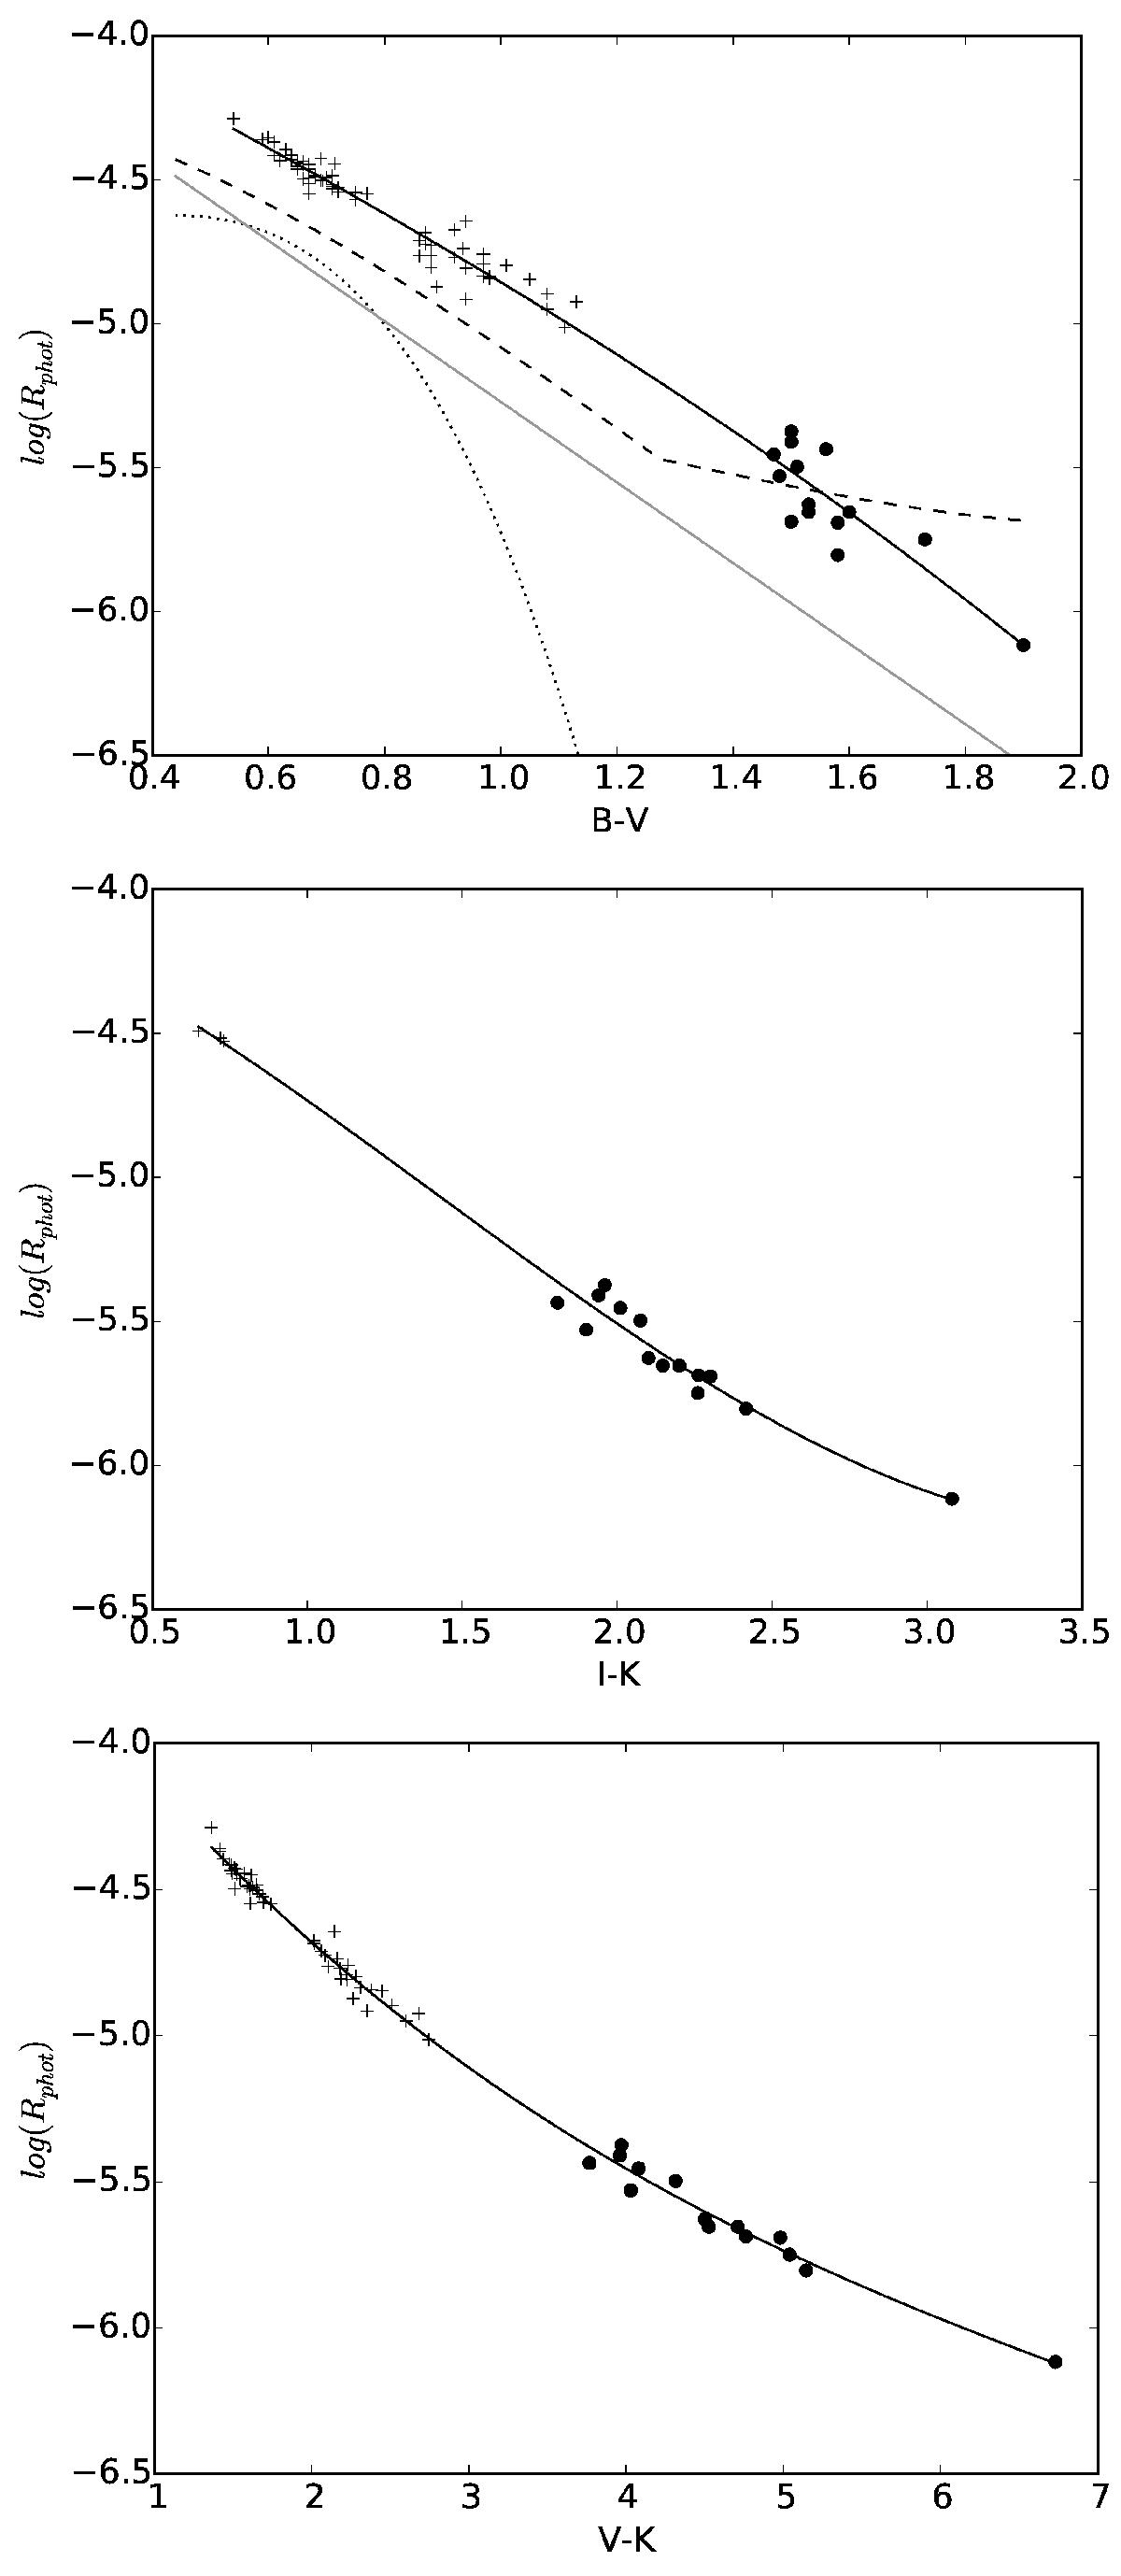
The photospheric factor as a function of, from top to bottom, B−V, I−K, and V−K. Dots and crosses represent Rphot for M and GK-dwarfs, respectively. The solid lines are from Eq. (11) for each one of the color indexes. In the top panel, we compare our relationship for the B−V colors to the ones of Hartmann et al. (1984), Noyes et al. (1984), and Mittag et al. (2013, only from synthetic spectra) in dotted, dashed, and dash-dotted lines, respectively. Their range of validity is 0.44 <B−V< 0.82 for Hartmann et al. (1984) and Noyes et al. (1984), and 0.44 <B−V< 1.6 for Mittag et al. (2013).
Current usage metrics show cumulative count of Article Views (full-text article views including HTML views, PDF and ePub downloads, according to the available data) and Abstracts Views on Vision4Press platform.
Data correspond to usage on the plateform after 2015. The current usage metrics is available 48-96 hours after online publication and is updated daily on week days.
Initial download of the metrics may take a while.