Fig. 4
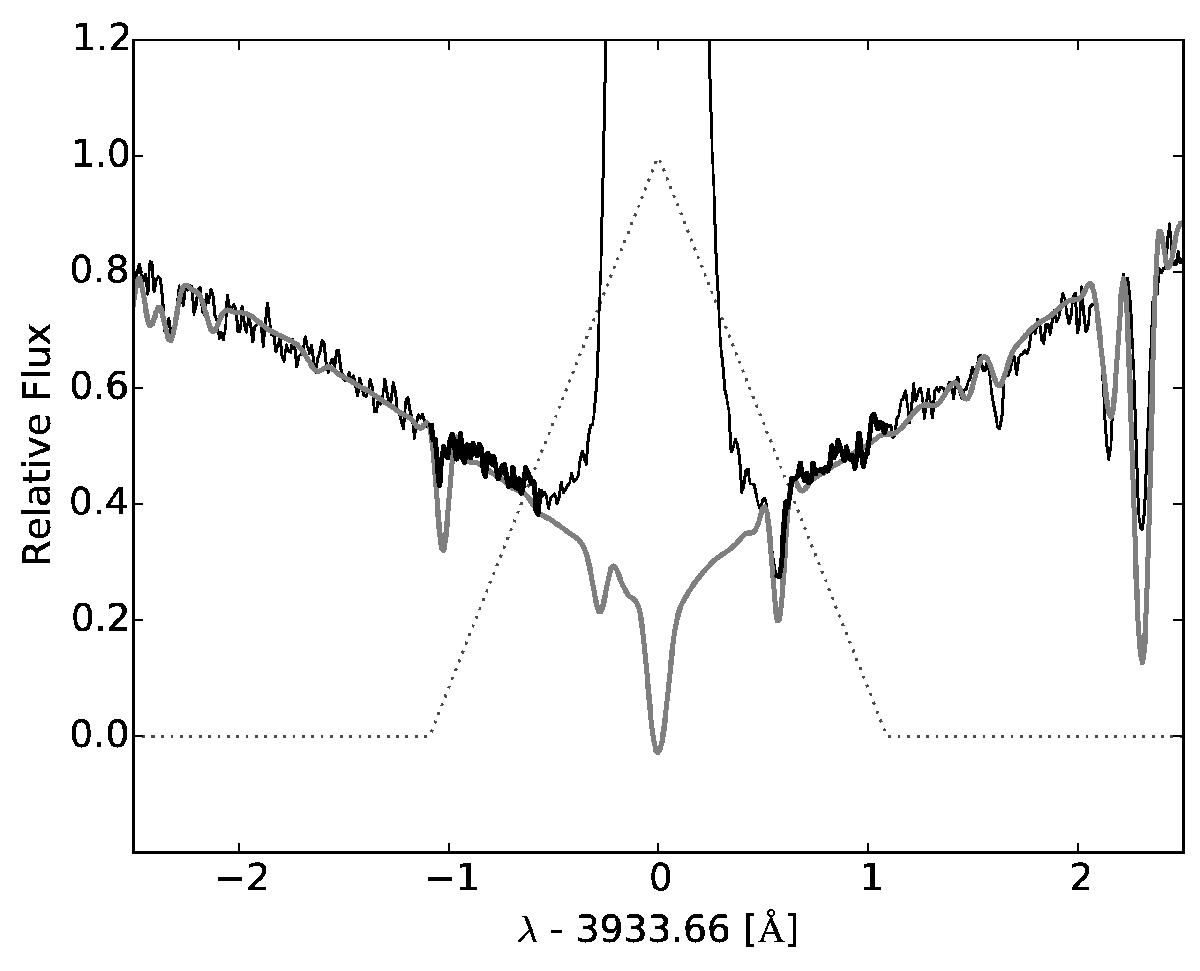
Spectrum of Gl 205 around the Ca II K line. The thin black and bold gray lines respectively represent the observed spectrum and a BT-Settl theoretical spectrum with Teff = 3800 [K], log (g [cm/s] ) = 4.5, and Fe/H = 0.0. The dotted curve depicts the K filter. The bold black line represents part of the spectral contribution through the triangular K filter used to estimate the photospheric contribution in a previous study (Hartmann et al. 1984).
Current usage metrics show cumulative count of Article Views (full-text article views including HTML views, PDF and ePub downloads, according to the available data) and Abstracts Views on Vision4Press platform.
Data correspond to usage on the plateform after 2015. The current usage metrics is available 48-96 hours after online publication and is updated daily on week days.
Initial download of the metrics may take a while.