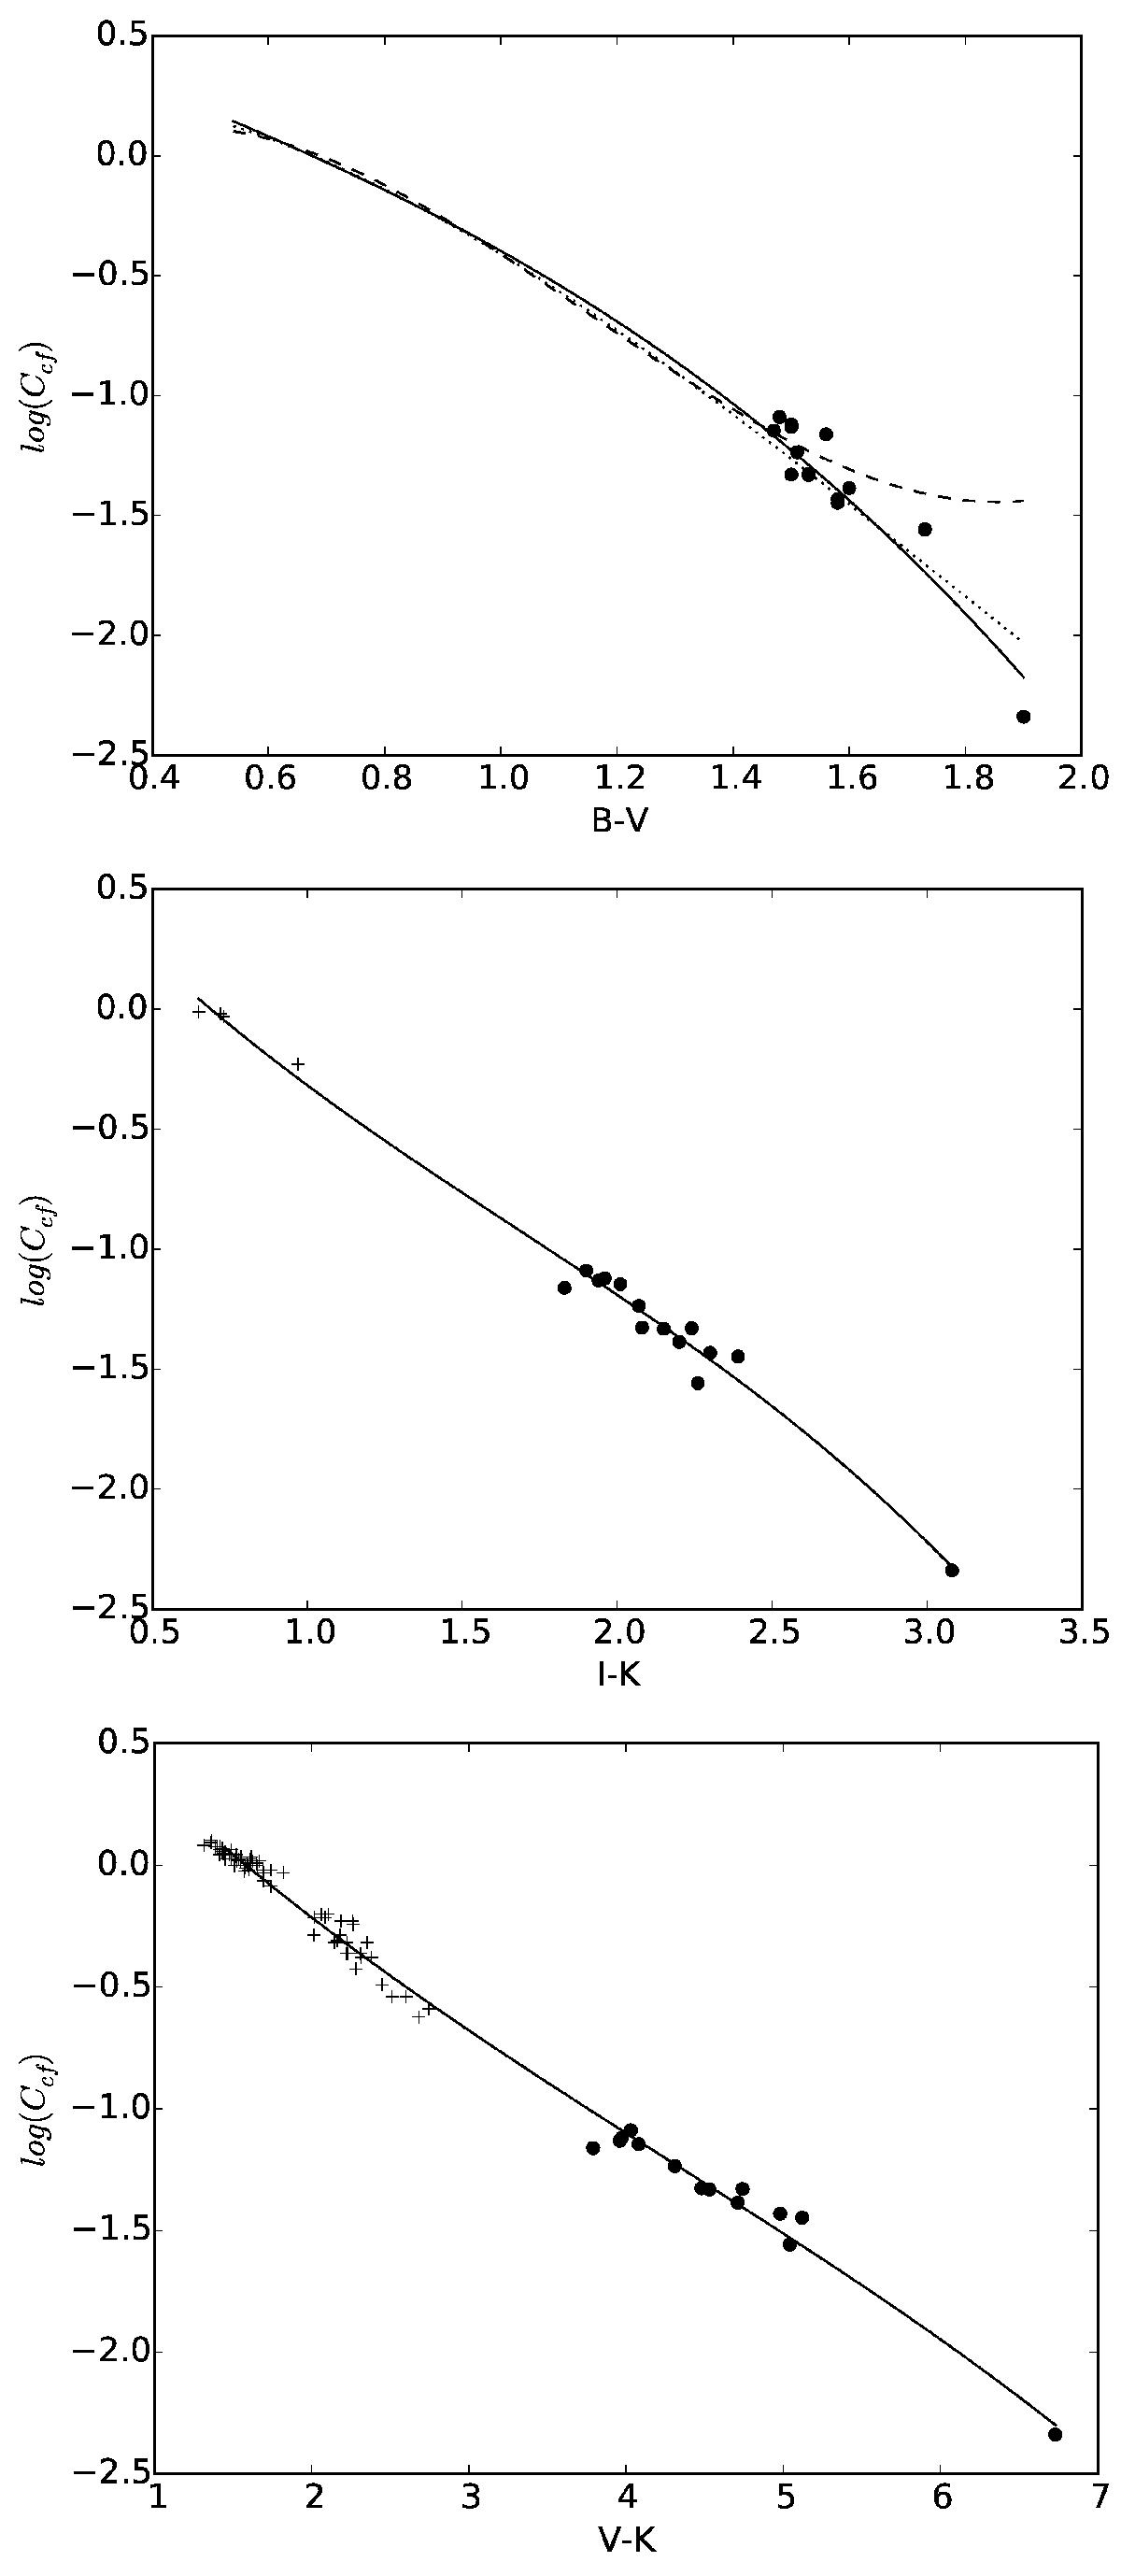
Fig. 3

The Ccf bolometric factor against B−V (top panel), I−K (middle panel), and V−K (bottom panel). Black dots represent the Ccf, M median, while crosses represent Ccf, Std. Solid lines represent the least-square fits of Eq. (9) for each color index. The top panel omits the 125 Ccf, Std(B−V) data points to more clearly display the Middelkoop (1982) and Rutten (1984) fits, represented by dashed and dotted lines. The validity ranges of these previous relationships are 0.45 <B−V< 1.50 and 0.3 <B−V< 1.6, respectively, and, for comparison, are extrapolated in this figure up to the color index of M dwarfs.
Current usage metrics show cumulative count of Article Views (full-text article views including HTML views, PDF and ePub downloads, according to the available data) and Abstracts Views on Vision4Press platform.
Data correspond to usage on the plateform after 2015. The current usage metrics is available 48-96 hours after online publication and is updated daily on week days.
Initial download of the metrics may take a while.


