Fig. 10
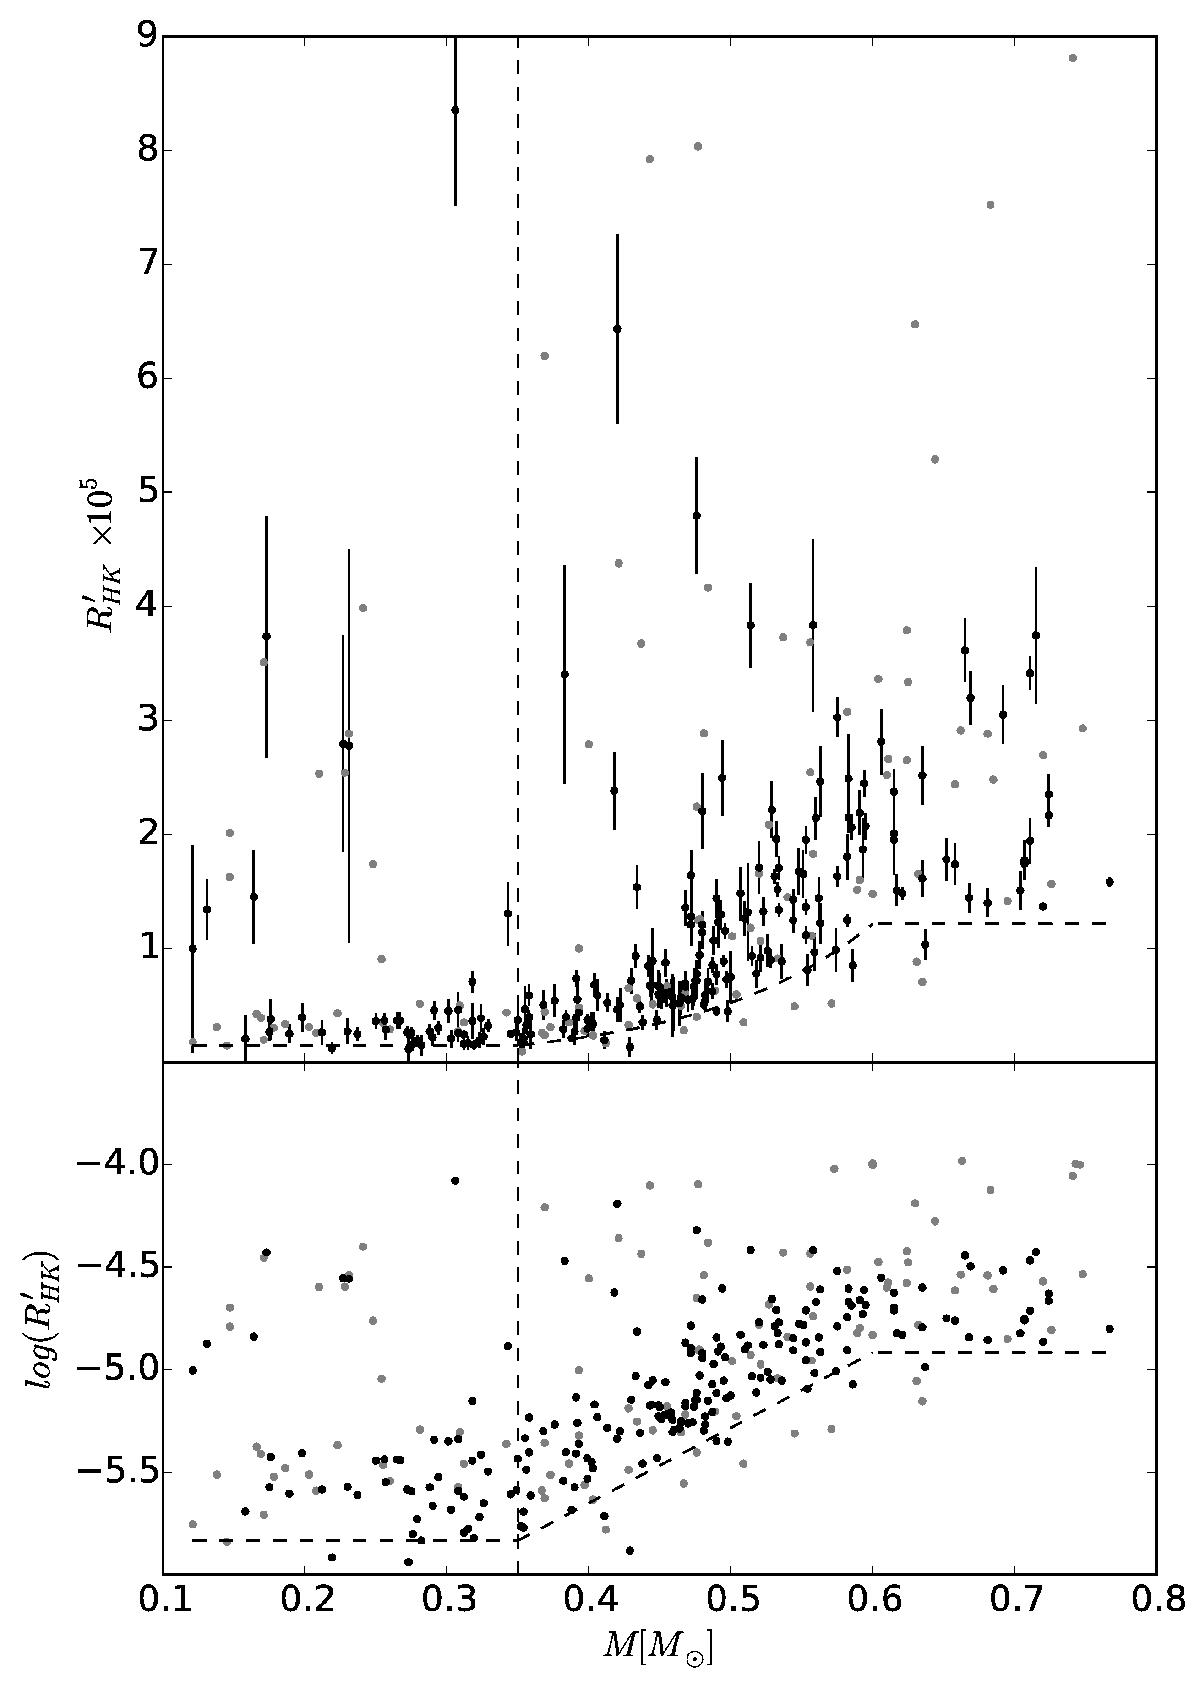
Median ![]() as a function of stellar mass, with the vertical errorbar representing the dispersion of the individual measurements (upper panel).
as a function of stellar mass, with the vertical errorbar representing the dispersion of the individual measurements (upper panel). ![]() as a function of stellar mass (lower panel). Black dots represent targets with at least six measurements with S/NVR, pix> 5, while gray dots represent the rest of the stars. Activity decreases with stellar mass down to approximately the mass for full convection (0.35 M⊙, marked by the vertical dashed line). Interestingly, M dwarfs departing further from the lower envelope (dashed curve) are those which present higher variability.
as a function of stellar mass (lower panel). Black dots represent targets with at least six measurements with S/NVR, pix> 5, while gray dots represent the rest of the stars. Activity decreases with stellar mass down to approximately the mass for full convection (0.35 M⊙, marked by the vertical dashed line). Interestingly, M dwarfs departing further from the lower envelope (dashed curve) are those which present higher variability.
Current usage metrics show cumulative count of Article Views (full-text article views including HTML views, PDF and ePub downloads, according to the available data) and Abstracts Views on Vision4Press platform.
Data correspond to usage on the plateform after 2015. The current usage metrics is available 48-96 hours after online publication and is updated daily on week days.
Initial download of the metrics may take a while.