| Issue |
A&A
Volume 599, March 2017
|
|
|---|---|---|
| Article Number | L9 | |
| Number of page(s) | 5 | |
| Section | Letters | |
| DOI | https://doi.org/10.1051/0004-6361/201630087 | |
| Published online | 14 March 2017 | |
A dearth of short-period massive binaries in the young massive star forming region M 17
Evidence for a large orbital separation at birth?
1 Institute of astrophysics, KU Leuven, Celestijnlaan 200D, 3001 Leuven, Belgium
e-mail: This email address is being protected from spambots. You need JavaScript enabled to view it.
2 Anton Pannekoek Institute for Astronomy, University of Amsterdam, Science Park 904, 1098 XH Amsterdam, The Netherlands
e-mail: This email address is being protected from spambots. You need JavaScript enabled to view it.
3 European Space Astronomy Centre (ESAC), Camino bajo del Castillo, s/n Urbanizacion Villafranca del Castillo, Villanueva de la Canada, 28 692 Madrid, Spain
4 Department of Astronomy, Stockholm University, Oskar Klein Center, 106 91 Stockholm, Sweden
Received: 18 November 2016
Accepted: 30 December 2016
Abstract
Aims. The formation of massive stars remains poorly understood and little is known about their birth multiplicity properties. Here, we aim to quantitatively investigate the strikingly low radial-velocity dispersion measured for a sample of 11 massive pre- and near-main-sequence stars (σ1D= 5.6 ± 0.2 km s-1) in the very young massive star forming region M 17, in order to obtain first constraints on the multiplicity properties of young massive stellar objects.
Methods. We compute the radial-velocity dispersion of synthetic populations of massive stars for various multiplicity properties and we compare the obtained σ1D distributions to the observed value. We specifically investigate two scenarios: a low binary fraction and a dearth of short-period binary systems.
Results. Simulated populations with low binary fractions (fbin = 0.12-0.09+0.16) or with truncated period distributions (Pcutoff > 9 months) are able to reproduce the low σ1D observed within their 68%-confidence intervals. Furthermore, parent populations with fbin > 0.42 or Pcutoff < 47 d can be rejected at the 5%-significance level. Both constraints are in stark contrast with the high binary fraction and plethora of short-period systems in few Myr-old, well characterized OB-type populations. To explain the difference in the context of the first scenario would require a variation of the outcome of the massive star formation process. In the context of the second scenario, compact binaries must form later on, and the cut-off period may be related to physical length-scales representative of the bloated pre-main-sequence stellar radii or of their accretion disks.
Conclusions. If the obtained constraints for the M 17’s massive-star population are representative of the multiplicity properties of massive young stellar objects, our results may provide support to a massive star formation process in which binaries are initially formed at larger separations, then harden or migrate to produce the typical (untruncated) power-law period distribution observed in few Myr-old OB binaries.
Key words: binaries: spectroscopic / stars: early-type / stars: formation / open clusters and associations: individual: M 17
© ESO, 2017
1. Introduction
In the quest to obtain observational constraints on the poorly understood massive star formation process (Zinnecker & Yorke 2007), two lines of research are currently pursued. The first line tries to get glimpses of the early phases of the formation process by penetrating the optically thick cloak of the emerging massive stars. This motivates observations at longer wavelengths and the search for the elusive massive star accretion disks. The second line of research attempts to constrain the formation process through some key properties of their end products. This includes constraints on the masses and rotation rates – and their distributions – as well as on their multiplicity properties. In this paper we focus on this latter aspect.
Spectroscopic searches for massive young stellar objects (mYSOs) in young (<1 Myr) star-forming regions were performed by, e.g., Bik et al. (2006, 2012), Ochsendorf et al. (2011) and Ellerbroek et al. (2013), but these analyses mostly focused on single star properties. The first search for young massive binaries was performed by Apai et al. (2007), who did a 2- to 3-epoch radial-velocity (RV) study of 16 embedded young massive stars in seven massive star forming regions. The authors identified two OB stars with RV variations of approximately 90 km s-1 and measured a RV dispersion (σ1D) of 35 km s-1 for the whole sample, and of 25 km s-1 after excluding the two close binaries. According to the authors, it was not possible to further statistically distinguish their sample σ1D from that of a single-star population given their large RV measurement errors.
With L = 3.6 × 10⁶L⊙ (Povich et al. 2007) and an age of less than 1 Myr (Hanson et al. 1997; Broos et al. 2007; Hoffmeister et al. 2008; Povich et al. 2009; Ramírez-Tannus et al. 2016, hereafter Paper I), the giant H ii region M 17 is one of the most luminous star-forming regions in our Galaxy. In Paper I, we characterized nine candidate mYSOs and three OB stars, all but one with stellar masses in the range of 6 to 20 M⊙. Stars in this mass range dominate some of the samples from which massive star multiplicity statistics are derived (e.g., Sana et al. 2012; Kobulnicky et al. 2014; Dunstall et al. 2015) and are thus particularly relevant. Despite its modest size, this sample is one of the largest among very young (likely <1 Myr) clusters where massive stars can be caught just after their formation phase.
Paper I revealed a lack of double-lined spectroscopic binaries and a narrow range of measured RVs (−10 < vrad < 20 km s-1). This is in stark contrast to the overall properties of small and large samples of fully formed, main-sequence massive stars (Kouwenhoven, et al. 2007; Sana et al. 2012, 2013a; Kiminki & Kobulnicky 2012; Kobulnicky et al. 2014; Dunstall et al. 2015; Almeida et al. 2017). These works have indeed established that 40% to 50% of OB-type binaries have a period of one month or less, with large RV amplitudes (Δvrad > 100 km s-1). Here we further investigate the modest RV dispersion of the massive star population in M 17 and make a first attempt at quantifying its multiplicity properties.
2. Observational constraints
2.1. Data overview
Our M 17’s sample is composed by 9 known candidate mYSOs1 (Hanson et al. 1997; Chini et al. 1980) – six of which were confirmed PMS stars in Paper I –, and three are OB stars observed in Paper I to trace the early-type main sequence (B111, B164 and B253, see Paper I for a discussion on B253). The known NGC 6618’s central binary CEN 1a (O4 V) as well as the CEN 18 and 37 binary candidates were not included because they were not mYSO candidates, nor were the remaining ~40 other O and early B stars in the region (Hoffmeister et al. 2008).
The data acquisition and data reduction are described in Paper I. In short, we acquired optical to near-infrared (300−2500 nm) spectra of each star using the X-shooter spectrograph (Vernet et al. 2011), yielding spectra with a resolving power λ/ Δλ of 3300 to 11 300 depending on the spectral range and slit width used. For three objects, spectra were taken at multiple epochs (Table A.1). The location of the sample stars in M 17’s field-of-view is displayed in Fig. 1 of Paper I.
2.2. Radial velocities and RV dispersion
We used the RV measurement method described in Sana et al. (2013a) and successfully applied to various sets of X-shooter data in, e.g., Sana et al. (2013b) and Tramper et al. (2016). It simultaneously adjusts all desired spectral lines (Table A.2) and all observational epochs (Table A.1) for a given object, taking into account the error spectrum or the signal-to-noise ratio. We have modified the method to be able to use a combination of Lorentz profiles (for H lines) and Gaussian profiles (for He and other metal lines). Prior to the fitting, the residual of the nebular contamination affecting the core of the H and of some He i lines were clipped from the data. No reliable measurement could be obtained for the PMS star B163 due to a lack of suitable lines and poor quality data. The star is excluded in the following. The obtained fits of the line profiles have a reduced χ2 in the range 0.6 to 1.3, and yield uncertainties on the measured RVs of less than 3 km s-1 (Table A.1). Larger uncertainties would only strengthen our results.
The obtained measurements yield a RV dispersion of σ1D = 5.6 ± 0.2 km s-1 (Table A.1). Restricting the computation of σ1D to the candidate mYSOs or to the confirmed PMS stars in our sample (Table A.1) yield similar values of 5.9 ± 0.2 and 6.9 ± 0.4 km s-1, respectively. These small differences have no impact on our results and we pursue our analysis with the full sample. Among the three stars with two or three epochs, only B268 presents significant RV variations and is a promising binary candidate.
The modest σ1D value that is observed is not expected if M 17’s mYSOs contains short-period binaries such as those that are frequently found in young stellar populations (e.g., Sana & Evans 2011). These short-period binaries are easily detected in spectroscopy and usually dominate the measured RV dispersion. Indeed, other studies of OB star populations with only a few epochs all measured a much larger velocity dispersion of the order of 25 to 35 km s-1 (e.g., Bosch et al. 2001; Apai et al. 2007; Hénault-Brunet et al. 2012).
3. Multiplicity properties
In this section, we investigate two possible scenarios to explain the observed low RV dispersion of the young massive star population in M 17: (i) a lower binary fraction, or (ii) a dearth of short-period binaries. We ignore the role of eccentricity and mass-ratio as these have a smaller impact on σ1D.
3.1. Methodology
To quantify the multiplicity properties of massive stars in M 17, we compare the RV dispersion of the observed sample with that resulting from Monte Carlo population synthesis computed with different underlying multiplicity properties. Each parent population, hence each Monte-Carlo run, is characterized by a primary- and a single-star mass function, a given binary fraction (fbin), a set of orbital parameter distributions and a cluster velocity dispersion (σcl).
We draw the masses of the single and of the primary stars from a Kroupa mass function ranging from 6 to 20M⊙. We adopt the multiplicity properties derived by Sana et al. (2013a) for Galactic young open clusters as the baseline in our population synthesis. These include fbin = 0.7 and fPorb ∝ (log 10Porb)-0.5, with 0.15 ≤ log 10(Porb/ day) ≤ 3.5 and a flat mass-ratio distribution. Adopting an Öpik law all the way down to orbital periods of 1 day would not change our conclusions.
The cluster velocity dispersion (σcl) is computed from the virial theorem, assuming a total mass for the M 17 cluster of 1.4 × 10³M⊙ (Stutzki & Guesten 1990) and a typical 1 pc cluster radius. This yields σcl = 2 km s-1. Other published mass estimates range from a few times 103 to 6 × 10⁴M⊙ (Pérez-Beaupuits et al. 2015; Povich et al. 2009), corresponding to σcl = 1.4 to 5.2 km s-1. Adopting the former value has no impact on our results while picking the latter one would only strengthen our conclusions because it leaves almost no room for binary contributions to the observed σ1D value. In the following, we adopt σcl = 2 km s-1.
Each Monte Carlo run is formed by 105 realisations and uses the sample size, number of epochs, time sampling and measurement accuracy of the observational sample. The density distributions of the simulated σ1D for given parent multiplicity properties are then constructed and used for tests of hypotheses that allow us to accept or reject the specific parent population at various significance levels.
3.2. A low binary fraction
We first investigate the possibility that the low RV dispersion observed in M 17 results from a low binary fraction. In our MC experiment, we keep the distribution of the orbital properties fixed and we vary the binary fraction from 0.00 to 1.00 in steps of 0.01. The obtained σ1D distributions for representative values of fbin are displayed in Fig. 1.
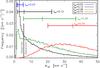 |
Fig. 1 Simulated σ1D distributions for different parent binary fractions. The vertical dashed line indicates the observed σ1D for our M 17 sample stars. The median, 0.16 and 0.84 percentiles of the simulated distributions are indicated on the upper part of the graph. The distribution corresponding to fbin = 0.03 is not shown for clarity; it is almost entirely dominated by the velocity dispersion of the cluster and thus peaks strongly at 2 km s-1 (≈σcl). |
The distribution whose median corresponds to our observed σ1D has fbin = 0.12. Distributions with fbin = 0.03 to 0.28 can all match the σ1D = 5.6 km s-1 within their 0.16 to 0.84 percentiles, that is, their predictions agree within ± 1σ with the observed value. We thus conclude that, given standard orbital parameter distributions, the observed velocity dispersion in M 17 is best reproduced by a low binary fraction  .
.
Similarly, no simulation with fbin ≥ 0.34 (resp. 0.42) can reproduce M 17’s σ1D within their 0.90 (resp. 0.95) percentiles and the corresponding hypotheses can thus be rejected at the 10 and 5%-significance levels, respectively.
3.3. A truncated period distribution
We now assume that the binary fraction is consistent with constraints from OB stars in young open clusters, that is, fbin = 0.7 for Porb< 3500 d (Sana et al. 2012), but that the binary population is composed of longer-period binaries, which typically results in a lower σ1D (Gieles et al. 2010; Hénault-Brunet et al. 2012). In practice, we adopt a truncated period distribution where the orbital periods of all binaries with Porb<Pcutoff are iteratively re-drawn from the parent distribution until they are equal to or larger than Pcutoff.
Resulting distributions for representative values of Pcutoff are shown in Fig. 2. Distributions with Pcutoff≈ 8 yr have a median that best matches the M 17’s observed σ1D while distributions with Pcutoff ≳ 283 d (≈9 months) are all able to reproduce the observed σ1D within their 68% confidence range. Parent populations with Pcutoff< 131 d (resp. 47 d) can be rejected at the 10 and 5%-significance levels, respectively.
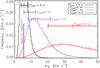 |
Fig. 2 Same as Fig. 1 for different cutoff periods (Pcutoff). The distribution corresponding to Pcutoff ≈ 9 mo is intermediate between those of Pcutoff ≈ 8 yr and 1 month and is not shown for clarity. |
4. Discussion
4.1. A low binary fraction?
Under the assumption that the distribution of orbital parameters in M 17 is not different from that of other well characterized OB-star populations, a low RV dispersion can only be explained by a low binary fraction. This, however, would make M 17 quite atypical. Populations of massive stars in clusters across the entire mass range have all revealed a large binary fraction, from modest star-forming regions such as the Orion Nebula and Sco-Cen (Preibisch et al. 1999; Kouwenhoven, et al. 2007) to massive associations with several tens of thousands of M⊙ of stellar content, such as, Cyg OB2 (Kobulnicky et al. 2014), the Carina nebula (Sana & Evans 2011) and the Tarantula region in the Large Magellanic Cloud (Sana et al. 2012; Dunstall et al. 2015).
Nearby young open clusters such as IC 1805, NGC 6231, M 16, and NGC 6611 have a similar mass to that of M 17. With typical ages of several Myr, they could be viewed as M 17’s older siblings. Yet, they all have a detected binary fraction of over 40% before any detection bias correction (De Becker et al. 2006; Sana et al. 2008, 2009, 2011). This would invalidate any temporal sequence, suggesting a variation in the outcome of the star-formation process (unless massive stars are paired at a later stage).
An alternative scenario that would produce a low binary fraction but that does not invoke variations in the star-formation process may involve runaways stars, which are indeed preferentially single objects (Mason et al. 2009; Sana et al. 2014). Given that the region is too young to have produced any supernovae, runaways in M 17 should result from dynamical ejection. This would imply that (i) M 17 has already gone through core collapse, (ii) the runaway ejection velocity is low (to preserve a low σ1D), and (iii) the initial massive star binary fraction was either low or lacked short-period systems. Short-period (hard) binaries are indeed expected to be ejected almost undisturbed and should still be seen in the runaway population if they were present in M 17’s original population.
The last possibility is that our sample is dominated by binary interaction products, which are known to most likely appear as single stars in RV studies (de Mink et al. 2014). Again, the young age of the region challenges this explanation unless these stars have exchanged mass or merged well within their pre-main-sequence evolution. The latter scenario cannot be widespread as it would be incompatible with the significant population of short-period binaries detected in the young clusters mentioned earlier.
4.2. A lack of short-period systems?
The existence of many short-period binaries is a well documented observational fact (Garmany et al. 1980; Mason et al. 1998; Sana & Evans 2011). Direct measurements of the orbital period distribution further confirm the relative abundance of short-period binaries, with at least 20% of all OB-type binaries having a period of less than a week; and 40% to 50%, a period of less than a month (Sana et al. 2012; Kobulnicky et al. 2014; Dunstall et al. 2015; Almeida et al. 2017).
However, the process that leads to the formation of these short-period systems remains mysterious. Core fission has fallen into demise (Tohline 2002) while other formation mechanisms such as disk fragmentation (Krumholz et al. 2009; Kratter et al. 2010) and dynamical capture (Fujii & Portegies Zwart 2011) predict binaries with typical orbital periods that are two to four orders of magnitude too long.
The possible lack of short-period binaries in one of the youngest populations of massive stars ever characterized is thus particularly intriguing and may suggest that massive binaries are originally formed at larger typical separations. The newly born binary systems should then harden on a time-scale of the order of 1 Myr or less to match the observational properties of main-sequence massive star populations of only a few Myr of age.
In the context of disk fragmentation theories, such an inward migration process may be driven by the interaction with the remnants of the accretion disk or with other, likely smaller mass, proto-stellar bodies. Migration may then stop with the disappearance of the sink of angular momentum, either as the circumbinary disk is destroyed or as other proto-stellar bodies are pushed far out or are ejected.
It is noteworthy that the minimum period cutoff that we derived (Pcutoff = 47 d) corresponds to the typical size of a (bloated) massive pre-main-sequence object (R ~ 100R⊙) while our most likely cut-off period (Pcutoff ≈ 8 yr) corresponds to approximately 10 AU in a 10 M⊙ system, that is, similar to the size of the first direct detection of the remnant of an accretion disk around a massive star (Kraus et al. 2010). While more and better constraints are desirable, it seems possible that the truncation of the period distribution, if real, can be related to meaningful physical scale-lengths in the formation process.
5. Conclusions
We have investigated the low radial-velocity dispersion (σ1D = 5.6 ± 0.2 km s-1) found in a sample of 11 massive pre/near main-sequence stars in the M 17 region. With an age of less than 1 Myr, this region is one of the youngest massive star forming regions for which a quantitative investigation of the multiplicity properties has been performed. We show that the low RV dispersion found is incompatible with multiplicity properties derived from older populations of massive stars.
The present results from the M 17 region seem to be corroborated by the multiplicity properties of Tr14, a dense young cluster (<1 Myr, Sana et al. 2010) in the Carina nebula. Though it has only six O stars with RV information (Sana & Evans 2011), none of them has been detected as a short-period binary (though see Maíz Apellániz et al. 2017, for HD 93129A).
If the multiplicity properties of the present M 17’s sample (and that of Tr14) were found to be representative of an earlier phase in the formation process than that of currently well characterized OB-star regions – as suggested by the younger age of M 17 – our results would support a formation mechanism where binaries are initially born at larger separations (100 R⊙ or more). They would also support the presence of a migration process that would harden the systems on a time-scale of the order of 1 Myr, or less, in order to match the observed multiplicity properties of OB-type populations.
While these speculations would fit well in a refinement of disk fragmentation theories, higher-quality observational
constraints (larger samples, more observational epochs) are needed. Theoretical and/or numerical computations to investigate, among others, the conditions for such a migration process to work are also highly desirable. These may lead to new insight into the origin of the relative universality of the period distribution of OB stars, which is an input ingredient of population synthesis needed to investigate the frequency of gravitational wave events.
We implicitly assumed in the present work that mYSO tracers used to identify most of our sample stars are not affected by binarity.
References
- Almeida, L. A., Sana, H., Taylor, W., et al. 2017, A&A, 598, A84 [NASA ADS] [CrossRef] [EDP Sciences] [Google Scholar]
- Apai, D., Bik, A., Kaper, L., Henning, T., & Zinnecker, H. 2007, ApJ, 655, 484 [NASA ADS] [CrossRef] [Google Scholar]
- Bik, A., Kaper, L., & Waters, L. B. F. M. 2006, A&A, 455, 561 [NASA ADS] [CrossRef] [EDP Sciences] [Google Scholar]
- Bik, A., Henning, T., Stolte, A., et al. 2012, ApJ, 744, 87 [NASA ADS] [CrossRef] [Google Scholar]
- Bosch, G., Selman, F., Melnick, J., & Terlevich, R. 2001, A&A, 380, 137 [NASA ADS] [CrossRef] [EDP Sciences] [Google Scholar]
- Broos, P. S., Feigelson, E. D., Townsley, L. K., et al. 2007, ApJS, 169, 353 [NASA ADS] [CrossRef] [Google Scholar]
- Bumgardner, T. E. 1992, Masters Thesis, Ohio State Univ., Columbus [Google Scholar]
- Chini, R., Elsaesser, H., & Neckel, T. 1980, A&A, 91, 186 [NASA ADS] [Google Scholar]
- De Becker, M., Rauw, G., Manfroid, J., & Eenens, P. 2006, A&A, 456, 1121 [NASA ADS] [CrossRef] [EDP Sciences] [Google Scholar]
- de Mink, S. E., Sana, H., Langer, N., Izzard, R. G., & Schneider, F. R. N. 2014, ApJ, 782, 7 [NASA ADS] [CrossRef] [Google Scholar]
- Dunstall, P. R., Dufton, P. L., Sana, H., et al. 2015, A&A, 580, A93 [NASA ADS] [CrossRef] [EDP Sciences] [Google Scholar]
- Ellerbroek, L. E., Bik, A., Kaper, L., et al. 2013, A&A, 558, A102 [NASA ADS] [CrossRef] [EDP Sciences] [Google Scholar]
- Fujii, M. S., & Portegies Zwart, S. 2011, Science, 334, 1380 [NASA ADS] [CrossRef] [Google Scholar]
- Garmany, C. D., Conti, P. S., & Massey, P. 1980, ApJ, 242, 1063 [NASA ADS] [CrossRef] [Google Scholar]
- Gieles, M., Sana, H., & Portegies Zwart, S. F. 2010, MNRAS, 402, 1750 [NASA ADS] [CrossRef] [Google Scholar]
- Hanson, M. M., Howarth, I. D., & Conti, P. S. 1997, ApJ, 489, 698 [NASA ADS] [CrossRef] [Google Scholar]
- Hénault-Brunet, V., Evans, C. J., Sana, H., et al. 2012, A&A, 546, A73 [NASA ADS] [CrossRef] [EDP Sciences] [Google Scholar]
- Hoffmeister, V. H., Chini, R., Scheyda, C. M., et al. 2008, ApJ, 686, 310 [NASA ADS] [CrossRef] [Google Scholar]
- Kiminki, D. C., & Kobulnicky, H. A. 2012, ApJ, 751, 4 [NASA ADS] [CrossRef] [Google Scholar]
- Kobulnicky, H. A., Kiminki, D. C., Lundquist, M. J., et al. 2014, ApJS, 213, 34 [NASA ADS] [CrossRef] [Google Scholar]
- Kouwenhoven, M. B. N., Brown, A. G. A., Portegies Zwart, S. F., & Kaper, L. 2007, A&A, 474, 77 [NASA ADS] [CrossRef] [EDP Sciences] [Google Scholar]
- Kratter, K. M., Matzner, C. D., Krumholz, M. R., & Klein, R. I. 2010, ApJ, 708, 1585 [NASA ADS] [CrossRef] [Google Scholar]
- Kraus, S., Hofmann, K.-H., Menten, K. M., et al. 2010, Nature, 466, 339 [NASA ADS] [CrossRef] [MathSciNet] [PubMed] [Google Scholar]
- Krumholz, M. R., Klein, R. I., McKee, C. F., Offner, S. S. R., & Cunningham, A. J. 2009, Science, 323, 754 [NASA ADS] [CrossRef] [PubMed] [Google Scholar]
- Maíz Apellániz, J., Sana, H., Barbá, R. H., Le Bouquin, J.-B., & Gamen, R. C. 2017, MNRAS, 464, 3561 [NASA ADS] [CrossRef] [Google Scholar]
- Mason, B. D., Gies, D. R., Hartkopf, W. I., et al. 1998, AJ, 115, 821 [NASA ADS] [CrossRef] [Google Scholar]
- Mason, B. D., Hartkopf, W. I., Gies, D. R., Henry, T. J., & Helsel, J. W. 2009, AJ, 137, 3358 [NASA ADS] [CrossRef] [EDP Sciences] [Google Scholar]
- Ochsendorf, B. B., Ellerbroek, L. E., Chini, R., et al. 2011, A&A, 536, L1 [NASA ADS] [CrossRef] [EDP Sciences] [Google Scholar]
- Ogura, K., & Ishida, K. 1976, PASJ, 28, 35 [NASA ADS] [Google Scholar]
- Pérez-Beaupuits, J. P., Stutzki, J., Ossenkopf, V., et al. 2015, A&A, 575, A9 [NASA ADS] [CrossRef] [EDP Sciences] [Google Scholar]
- Povich, M. S., Stone, J. M., Churchwell, E., et al. 2007, ApJ, 660, 346 [NASA ADS] [CrossRef] [Google Scholar]
- Povich, M. S., Churchwell, E., Bieging, J. H., et al. 2009, ApJ, 696, 1278 [NASA ADS] [CrossRef] [Google Scholar]
- Preibisch, T., Balega, Y., Hofmann, K.-H., Weigelt, G., & Zinnecker, H. 1999, New Astron., 4, 531 [NASA ADS] [CrossRef] [Google Scholar]
- Ramírez-Tannus, Kaper, L., de Koter, A. 2016, A&A, submitted (Paper I) [Google Scholar]
- Sana, H., & Evans, C. J. 2011, in IAU Symp., eds. C. Neiner, G. Wade, G. Meynet, & G. Peters, 272, 474 [Google Scholar]
- Sana, H., Gosset, E., Nazé, Y., Rauw, G., & Linder, N. 2008, MNRAS, 386, 447 [NASA ADS] [CrossRef] [Google Scholar]
- Sana, H., Gosset, E., & Evans, C. J. 2009, MNRAS, 400, 1479 [NASA ADS] [CrossRef] [Google Scholar]
- Sana, H., Momany, Y., Gieles, M., et al. 2010, A&A, 515, A26 [NASA ADS] [CrossRef] [EDP Sciences] [Google Scholar]
- Sana, H., James, G., & Gosset, E. 2011, MNRAS, 416, 817 [NASA ADS] [CrossRef] [Google Scholar]
- Sana, H., de Mink, S. E., de Koter, A., et al. 2012, Science, 337, 444 [Google Scholar]
- Sana, H., de Koter, A., de Mink, S. E., et al. 2013a, A&A, 550, A107 [NASA ADS] [CrossRef] [EDP Sciences] [Google Scholar]
- Sana, H., van Boeckel, T., Tramper, F., et al. 2013b, MNRAS, 432, L26 [NASA ADS] [CrossRef] [Google Scholar]
- Sana, H., Le Bouquin, J.-B., Lacour, S., et al. 2014, ApJS, 215, 15 [NASA ADS] [CrossRef] [Google Scholar]
- Stutzki, J., & Guesten, R. 1990, ApJ, 356, 513 [NASA ADS] [CrossRef] [Google Scholar]
- Tohline, J. E. 2002, ARA&A, 40, 349 [NASA ADS] [CrossRef] [Google Scholar]
- Tramper, F., Sana, H., Fitzsimons, N. E., et al. 2016, MNRAS, 455, 1275 [NASA ADS] [CrossRef] [Google Scholar]
- Vernet, J., Dekker, H., D’Odorico, S., et al. 2011, A&A, 536, A105 [NASA ADS] [CrossRef] [EDP Sciences] [Google Scholar]
- Zinnecker, H., & Yorke, H. W. 2007, ARA&A, 45, 481 [NASA ADS] [CrossRef] [Google Scholar]
Appendix A: Tables
Sample stars and journal of the observations.
Spectral lines available for RV measurements.
All Tables
All Figures
|
Fig. 1 Simulated σ1D distributions for different parent binary fractions. The vertical dashed line indicates the observed σ1D for our M 17 sample stars. The median, 0.16 and 0.84 percentiles of the simulated distributions are indicated on the upper part of the graph. The distribution corresponding to fbin = 0.03 is not shown for clarity; it is almost entirely dominated by the velocity dispersion of the cluster and thus peaks strongly at 2 km s-1 (≈σcl). |
| In the text | |
|
Fig. 2 Same as Fig. 1 for different cutoff periods (Pcutoff). The distribution corresponding to Pcutoff ≈ 9 mo is intermediate between those of Pcutoff ≈ 8 yr and 1 month and is not shown for clarity. |
| In the text | |
Current usage metrics show cumulative count of Article Views (full-text article views including HTML views, PDF and ePub downloads, according to the available data) and Abstracts Views on Vision4Press platform.
Data correspond to usage on the plateform after 2015. The current usage metrics is available 48-96 hours after online publication and is updated daily on week days.
Initial download of the metrics may take a while.