Fig. 1
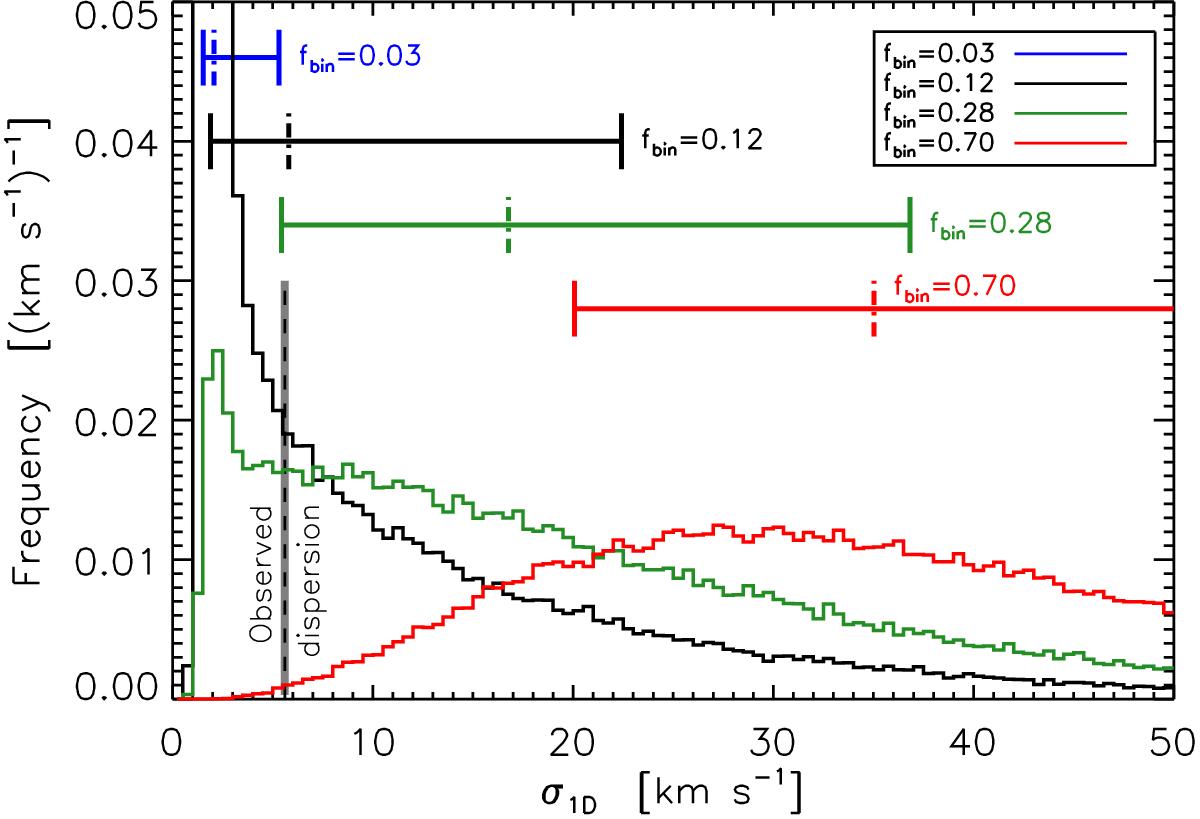
Simulated σ1D distributions for different parent binary fractions. The vertical dashed line indicates the observed σ1D for our M 17 sample stars. The median, 0.16 and 0.84 percentiles of the simulated distributions are indicated on the upper part of the graph. The distribution corresponding to fbin = 0.03 is not shown for clarity; it is almost entirely dominated by the velocity dispersion of the cluster and thus peaks strongly at 2 km s-1 (≈σcl).
Current usage metrics show cumulative count of Article Views (full-text article views including HTML views, PDF and ePub downloads, according to the available data) and Abstracts Views on Vision4Press platform.
Data correspond to usage on the plateform after 2015. The current usage metrics is available 48-96 hours after online publication and is updated daily on week days.
Initial download of the metrics may take a while.