Fig. 6
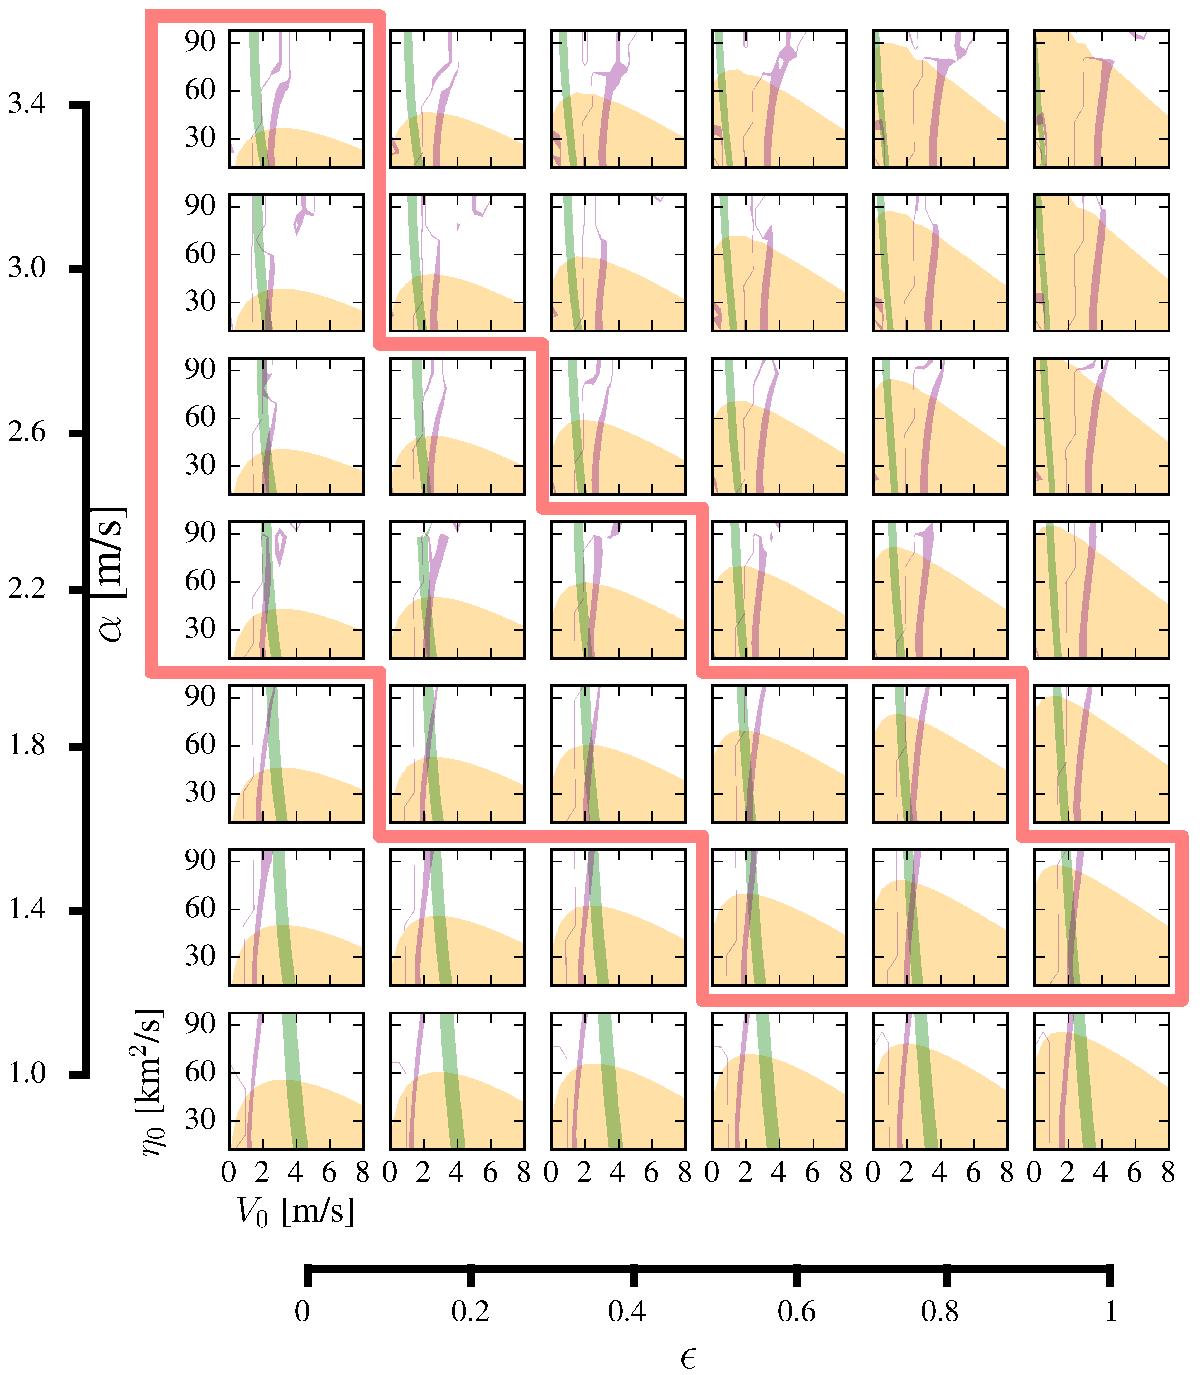
Results of the complete parameter study, for which all four parameters describing the subsurface dynamics were varied. For each set of parameters, a simulation was performed and the dynamo period, growth rate, and phase difference between the emergence rate and polar fields was determined. The green bands indicate the range of periods between 21 and 23 yr, the purple bands the range of the phase difference between 80° and 100°. The regions shaded in orange indicate dynamo excitation (positive growth rate). The red outline encloses those panels where solutions matching all three constraints exist.
Current usage metrics show cumulative count of Article Views (full-text article views including HTML views, PDF and ePub downloads, according to the available data) and Abstracts Views on Vision4Press platform.
Data correspond to usage on the plateform after 2015. The current usage metrics is available 48-96 hours after online publication and is updated daily on week days.
Initial download of the metrics may take a while.