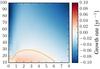
Fig. 4
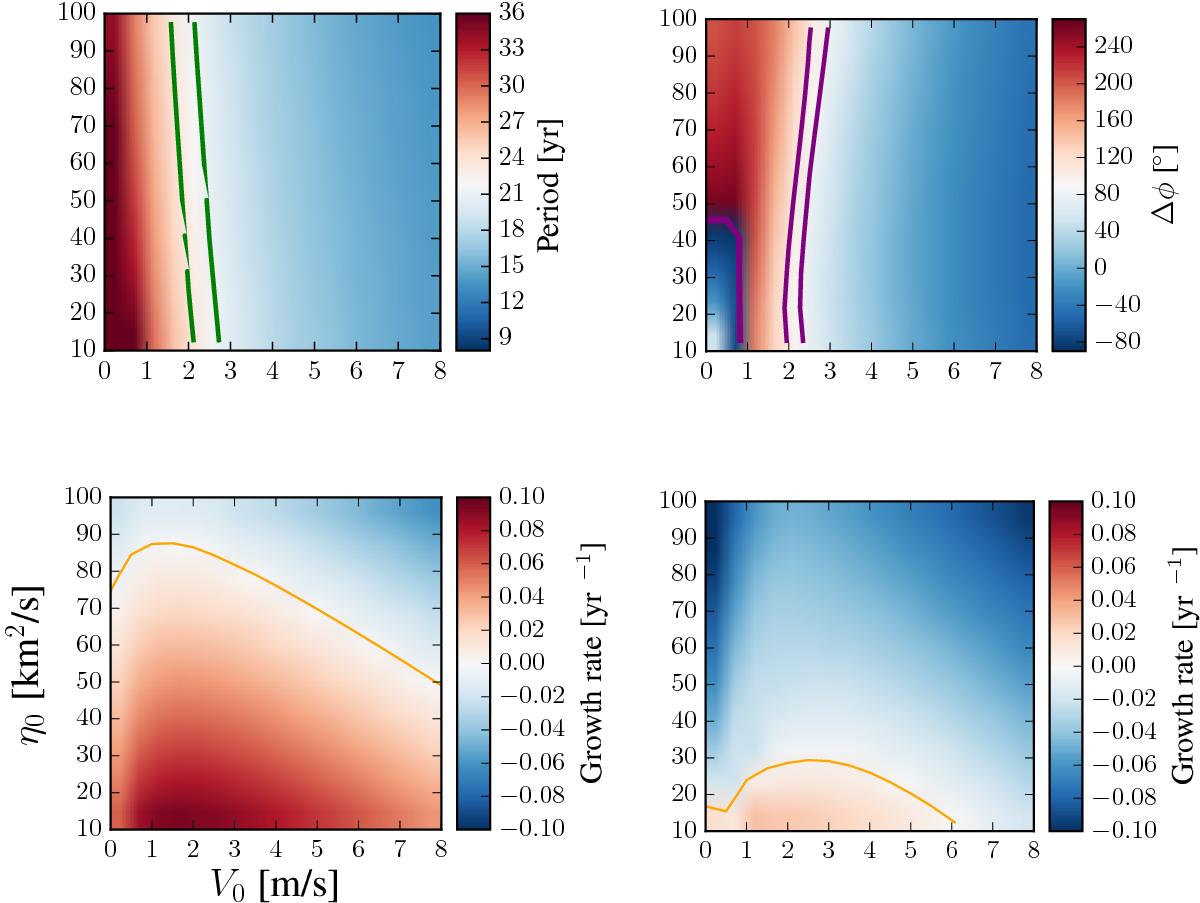
Properties of linear dynamo solutions as functions of the amplitude of the effective return meridional flow (V0) and of the magnetic diffusivity in the convection zone (η0) for values of α = 1.4 m s-1 and ϵ = 1. Color shading represents the dynamo period (P, upper left panel), the phase difference between the maximum of the polar field and the maximum rate of flux emergence (Δφ, upper right panel), and the dynamo growth rate (γ, lower left panel), all for dipole parity. The growth rate for quadrupolar parity is given in lower right panel. The lines in the lower panels indicate γ = 0, thus dividing regions of excited (reddish) and decaying (blueish) dynamo solutions. The lines in the upper panels indicate ranges relevant for the solar dynamo: 21 yr ≤ P ≤ 23 yr for the period and 80° ≤ Δφ ≤ 100° for the phase difference.
Current usage metrics show cumulative count of Article Views (full-text article views including HTML views, PDF and ePub downloads, according to the available data) and Abstracts Views on Vision4Press platform.
Data correspond to usage on the plateform after 2015. The current usage metrics is available 48-96 hours after online publication and is updated daily on week days.
Initial download of the metrics may take a while.