Fig. 1
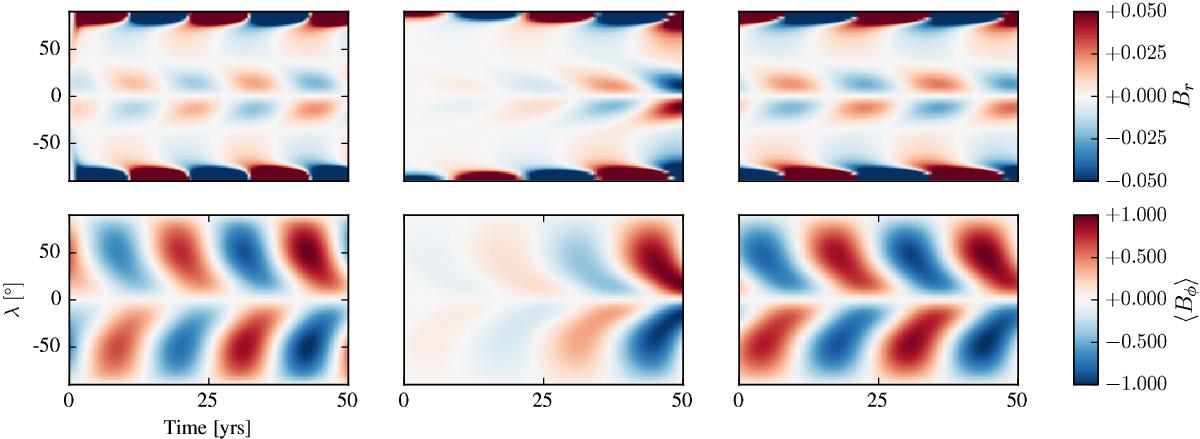
Test case KC1: comparison of the updated Leighton model with the results of the 2D dynamo run presented in Fig. 9 of Karak & Cameron (2016). The left column gives the results of the 2D run, showing time-latitude diagrams for the radial field at the surface (upper panel) and the radially averaged toroidal field (lower panel). The other two columns show the results of the updated Leighton model: using parameters corresponding to those of the 2D model (middle column) and with the diffusivity in the convection zone increased so that the dynamo has zero linear growth rate (right column). The quantities are normalized by a common factor, such that the extrema of ⟨ Bφ ⟩ become ±1.
Current usage metrics show cumulative count of Article Views (full-text article views including HTML views, PDF and ePub downloads, according to the available data) and Abstracts Views on Vision4Press platform.
Data correspond to usage on the plateform after 2015. The current usage metrics is available 48-96 hours after online publication and is updated daily on week days.
Initial download of the metrics may take a while.