Free Access
Fig. 5
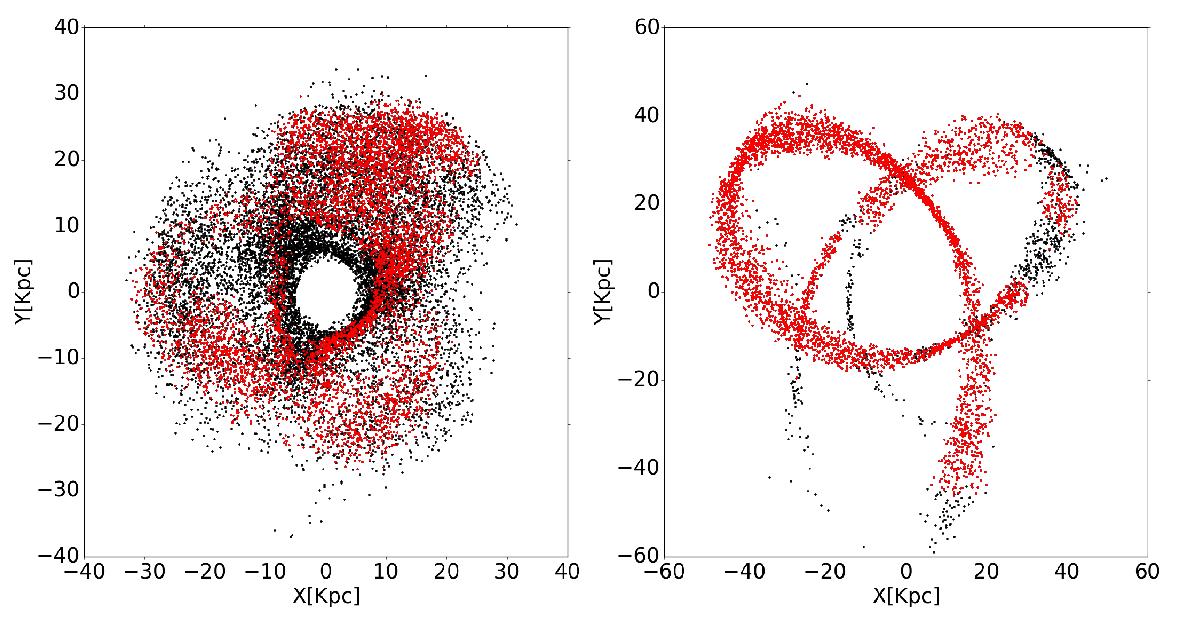
X-Y projections of Bullock & Johnston (2005) overdensity 63 (left) and overdensity 33 (right) are plotted in black. The OPTICS partitions are overplotted in red. The other overlapping overdensities are not plotted for the sake of clarity, but are the main reason the completeness is not 100%.
Current usage metrics show cumulative count of Article Views (full-text article views including HTML views, PDF and ePub downloads, according to the available data) and Abstracts Views on Vision4Press platform.
Data correspond to usage on the plateform after 2015. The current usage metrics is available 48-96 hours after online publication and is updated daily on week days.
Initial download of the metrics may take a while.