Fig. 2
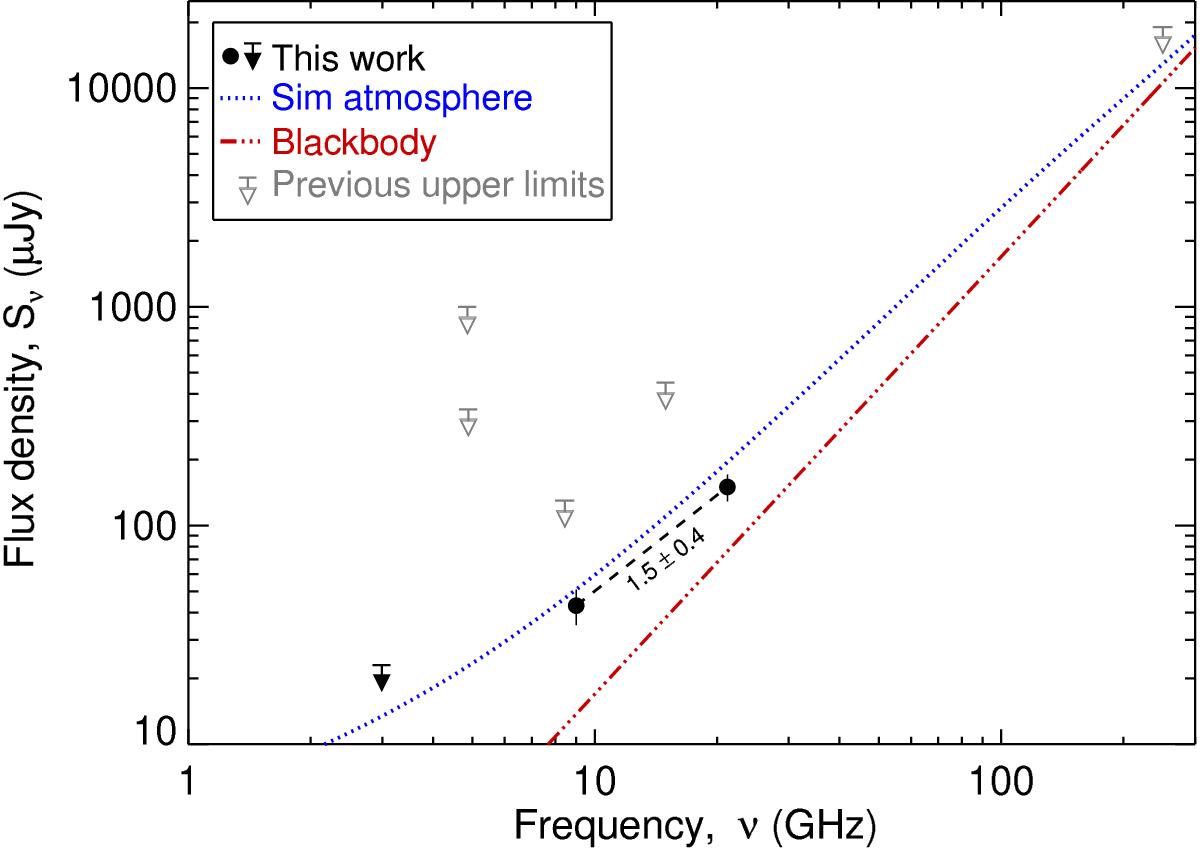
Radio spectral energy distribution for Pollux between 1 and 300 GHz. The red dash-dotted line is the expected blackbody emission assuming a uniform intensity disk with angular diameter φ = φ⋆ and brightness temperature Tb = Teff. The black filled circles are the VLA detections at 21.2 and 9 GHz. The blue dotted line is the expected spectral energy distribution of Pollux using the model atmosphere from Sim (2001). Our 3 GHz upper limit is also shown along with previous upper limits taken from Wendker (1995). The black dashed line represents a least-square fit to our detections assuming that Sν ∝ να.
Current usage metrics show cumulative count of Article Views (full-text article views including HTML views, PDF and ePub downloads, according to the available data) and Abstracts Views on Vision4Press platform.
Data correspond to usage on the plateform after 2015. The current usage metrics is available 48-96 hours after online publication and is updated daily on week days.
Initial download of the metrics may take a while.