Fig. 1
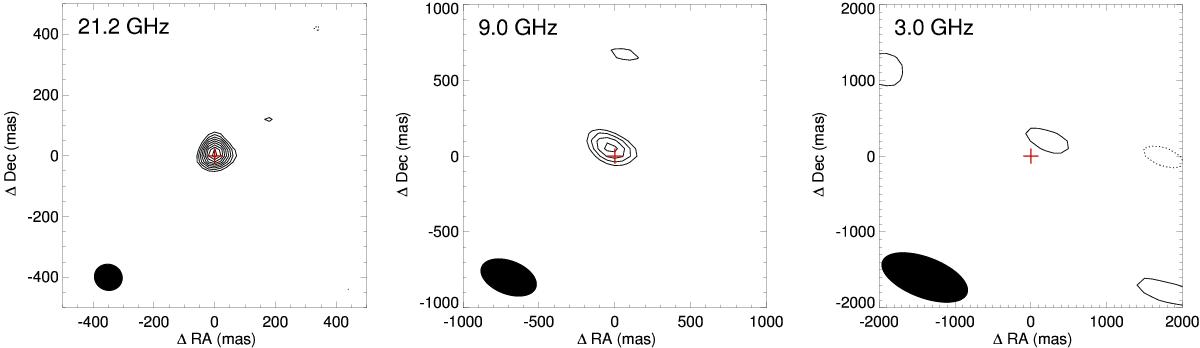
Radio images of Pollux at 21.2 GHz (left), 9 GHz (middle), and 3 GHz (right). Contours are set to (− 3,3,4,...11) × σrms where σrms is the rms noise in each image. The red cross marks the expected position of the photosphere at the epoch of each observation. The restoring beam is shown in the bottom left of each image. Note the scales on the axes in each panel double in size from left to right.
Current usage metrics show cumulative count of Article Views (full-text article views including HTML views, PDF and ePub downloads, according to the available data) and Abstracts Views on Vision4Press platform.
Data correspond to usage on the plateform after 2015. The current usage metrics is available 48-96 hours after online publication and is updated daily on week days.
Initial download of the metrics may take a while.