Fig. 7
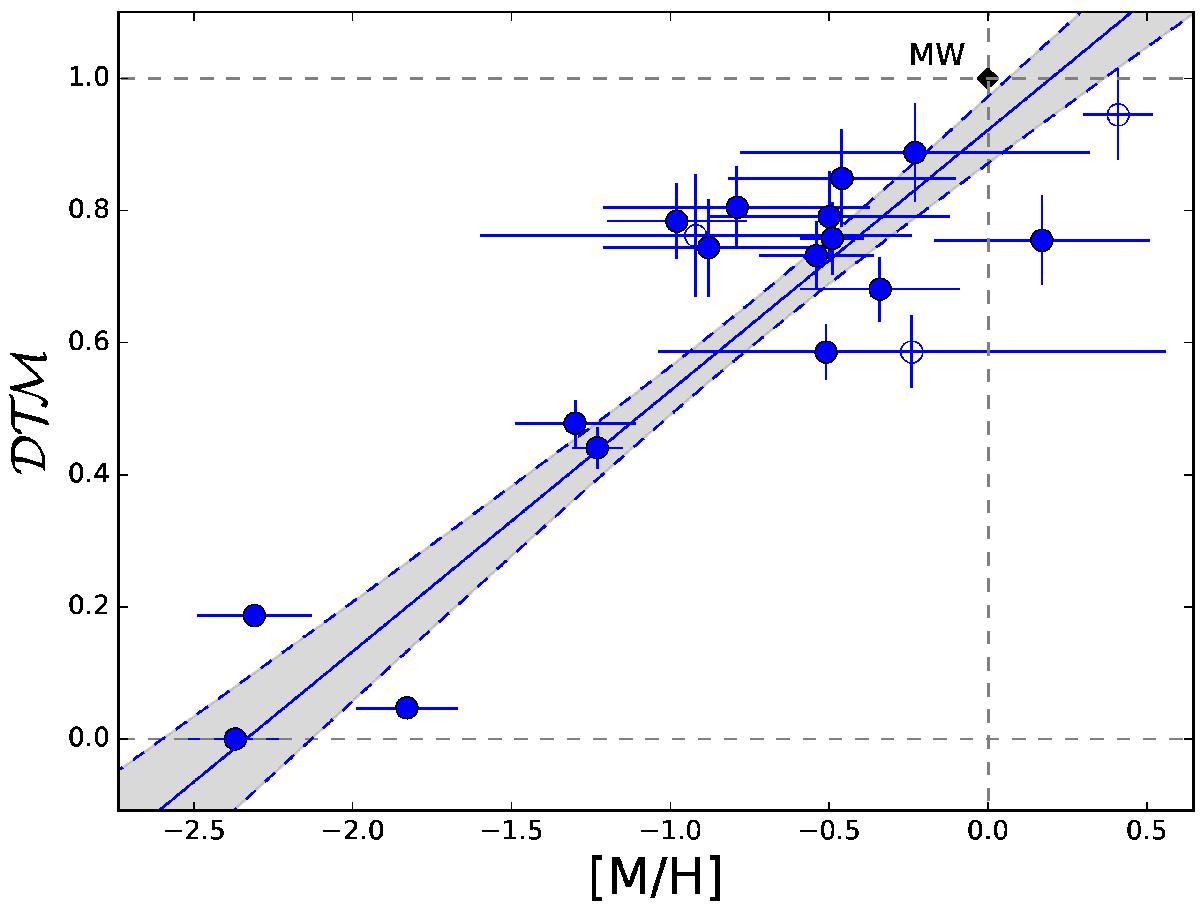
![]() as calculated using Eq. (8) as a function of metallicity. The dashed line and shaded area is a linear fit to the data and its 1σ confidence interval respectively, tracing a significant positive correlation between the two variables. The trend is predominantly set by the lowest metallicity points, with those data points at [M/H] > −1 showing no obvious trend. The Milky Way is shown by a black point at [M/H] = 0,
as calculated using Eq. (8) as a function of metallicity. The dashed line and shaded area is a linear fit to the data and its 1σ confidence interval respectively, tracing a significant positive correlation between the two variables. The trend is predominantly set by the lowest metallicity points, with those data points at [M/H] > −1 showing no obvious trend. The Milky Way is shown by a black point at [M/H] = 0, ![]() = 1.
= 1.
Current usage metrics show cumulative count of Article Views (full-text article views including HTML views, PDF and ePub downloads, according to the available data) and Abstracts Views on Vision4Press platform.
Data correspond to usage on the plateform after 2015. The current usage metrics is available 48-96 hours after online publication and is updated daily on week days.
Initial download of the metrics may take a while.