| Issue |
A&A
Volume 599, March 2017
|
|
|---|---|---|
| Article Number | A42 | |
| Number of page(s) | 14 | |
| Section | Interstellar and circumstellar matter | |
| DOI | https://doi.org/10.1051/0004-6361/201629067 | |
| Published online | 24 February 2017 | |
Shock-wave processing of C60 in hydrogen
1 Institut de Physique de Rennes, UMR CNRS 6251, Université de Rennes 1, Campus de Beaulieu, 35042 Rennes Cedex, France
e-mail: ludovic.biennier@univ-rennes1.fr
2 Shock Induced Materials Chemistry Lab, Solid State and Structural Chemistry Unit, Indian Institute of Science, 560012 Bangalore, India
3 Inorganic and Physical Chemistry, Indian Institute of Science, 560012 Bangalore, India
4 UJF-Grenoble 1/UMR CNRS 5588, Laboratoire Interdisciplinaire de Physique, 38041 Grenoble, France
5 Institut d’Astrophysique Spatiale, UMR CNRS 8617, Université Paris-Sud, Bât. 121, 91405 Orsay, France
6 Department of Aerospace Engineering, Indian Institute of Science, 560012 Bangalore, India
Received: 6 June 2016
Accepted: 24 October 2016
Context. Interstellar carbonaceous particles and molecules are subject to intense shocks in astrophysical environments. Shocks induce a rapid raise in temperature and density which strongly affects the chemical and physical properties of both the gas and solid phases of the interstellar matter.
Aims. The shock-induced thermal processing of C60 particles in hydrogen has been investigated in the laboratory under controlled conditions up to 3900 K with the help of a material shock-tube.
Methods. The solid residues generated by the exposure of a C60/H2 mixture to a millisecond shock wave were collected and analyzed using X-ray diffraction, scanning electron microscopy, transmission electron microscopy, Raman micro-spectroscopy, and infrared micro-spectroscopy. The gaseous products were analyzed by Gas Chromatography and Cavity Ring Down Spectroscopy.
Results. Volatile end-products appear above reflected shock gas temperatures of ~2540 K and reveal the substantial presence of small molecules with one or two C atoms. These observations confirm the role played by the C2 radical as a major product of C60 fragmentation and less expectedly highlight the existence of a single C atom loss channel. Molecules with more than two carbon atoms are not observed in the post-shock gas. The analysis of the solid component shows that C60 particles are rapidly converted into amorphous carbon with a number of aliphatic bridges.
Conclusions. The absence of aromatic CH stretches on the IR spectra indicates that H atoms do not link directly to aromatic cycles. The fast thermal processing of C60 in H2 over the 800–3400 K temperature range leads to amorphous carbon. The analysis hints at a collapse of the cage with the formation of a few aliphatic connections. A low amount of hydrogen is incorporated into the carbon material. This work extends the range of applications of shock tubes to studies of astrophysical interest.
Key words: astrochemistry / shock waves / circumstellar matter / dust, extinction / methods: laboratory: solid state
© ESO, 2017
1. Introduction
The molecular inventory of carbon allotropes in space has been enriched with the spectroscopic identification of fullerenes C60 and C70 infrared emission lines in planetary nebula and young stellar object circumstellar environments (Sellgren et al. 2009, 2010; Cami et al. 2010; Garcia-Hernandez et al. 2012; Roberts et al. 2012). More recently, laboratory spectroscopic measurements confirmed C as the carrier of two diffuse interstellar bands seen in absorption at 9632 and 9577 Å(Campbell et al. 2015). The fullerene C60 was discovered 30 yr ago in the laboratory by Kroto et al. (1985) during experiments aimed at understanding carbon chemistry in circumstellar shells of late-type stars. Through intense stellar winds, evolved low-mass stars fill the interstellar medium (ISM) with material enriched in their interiors. During the stellar wind expansion, the circumstellar matter cools and particles nucleate through the condensation of carbon and/or silicon bearing species. Carbon dust is mainly produced and injected into the ISM of galaxies by cool and extended atmospheres of the asymptotic branch of red giant stars (e.g., Ferrarotti & Gail 2006; Zhukovska et al. 2008; Matsuura et al. 2013). As the red giant burns out its fuel, it eventually collapses while the outer layers are ejected in a shell of gas. The small core, a newly formed white dwarf, ionizes the gaseous envelope observed in emission, thus forming a planetary nebula. The contribution to the production of carbon dust generated by supernovae is still debated. While chemical and physical processes are enhanced by the raise in temperature and pressure behind the shock wave generated by the supernova, dust grains are also destroyed in the process by a variety of mechanisms (see e.g. Jones et al. 1996; Dwek et al. 1996; Bocchio et al. 2014; Slavin et al. 2015, and references therein).
Before examining the shock processing of fullerenes, a peculiar form of carbon dust, we briefly recall some aspects of their formation. In the laboratory, there are several methods to generate fullerenes. Kratschmer et al. (1990) showed that fullerenes can be efficiently produced in an arc vaporization of graphite. This method can generate large quantities of fullerene-containing carbon soot. Fullerenes can also be formed by the condensation of a plume produced by laser ablation of a graphite target (Kroto et al. 1985; Jäger et al. 2009) or by condensation of products of laser-induced pyrolysis of hydrocarbons (Jäger et al. 2009). In such experiments, two temperature regimes are identified. Below 1700 K, condensation by-products are mainly polycyclic aromatic hydrocarbons (PAHs). Above 3500 K, fullerene-like carbon grains and fullerene compounds are formed.
Different models have been developed to understand the formation of C60. Several broad classes have been identified; four of which we mention here: (1) the “pentagon road”, where open graphitic sheets rearrange to incorporate pentagons as well as hexagons in the bonding pattern. Pentagons cause the sheet to curl and enable dangling bonds to join (Smalley 1992); (2) the “fullerene road”, which is based on the growth of smaller fullerenes by C2 insertion (Heath 1991); (3) the “folding road” where fullerene cages are “knitted” following ring condensation reactions (Bunz et al. 1999) and (4) the “shrinking hot giant road” where the carbon vapor far from equilibrium follows a size-up/size down pathway (Irle et al. 2006). Following up on the fullerene road model, recent detailed experiments have shown that fullerenes can self-assemble by a bottom-up closed network growth (CNG) mechanism which incorporates atomic C and C2 into closed cages because energetic barriers are low or nonexistent (Dunk et al. 2012). This latter scenario is very interesting because unlike the others, the presence of hydrogen doesn’t hamper the growth of the network. It could therefore be possible in circumstellar environments such as planetary nebula (PNe).
However, because high gas densities of small compounds are required for bottom-up formation routes of C60 (e.g., from the pyrolysis of hydrocarbons), they cannot account for the astronomical observations in tenuous environments (Micelotta et al. 2012; Berné & Tielens 2012). Top down schemes have also been investigated. They include, for instance, the experimental study of electron bombardment of graphene. The irradiation results in the loss of carbon atoms from the edges of the graphene layer, leading to the formation of pentagons, which in turn induces the curving of the graphene into a bowl-shaped structure (Chuvilin et al. 2010). The relevance of this process for astrophysical environments still lacks a detailed investigation of the influence of the electron flux on the direct transformation from graphene to fullerene and of the substrate (e.g., charging). Some other routes could also be considered. The theoretical study of Micelotta et al. (2010b) suggests that the vibrational excitation of PAHs by impacting ions or electrons may lead to re-structuring into more stable fullerene-type species.Further theoretical investigations of PAHs in a hot gas (Micelotta et al. 2010a) predict that erosion proceeds mainly through ejection of C2 groups following electron collisions and vibrational excitation. As a consequence, the aromatic structure will tend to be preserved throughout the destruction process. Berné & Tielens (2012) proposed a chemical route in which C60 is formed directly by the photochemical processing of large PAH molecules. Further photochemical modeling studies have shown that under UV irradiation, large PAHs become fully dehydrogenated and fold into a floppy closed cage which shrinks by loss of C2 units until it reaches the symmetric C60 molecule (Berné et al. 2015). Ion trap/time-of-flight photo-fragmentation spectrometric studies confirm this top-down synthesis route (Zhen et al. 2014).
Nevertheless, the efficiency of photo-induced dehydrogenation of large PAHs to explain the abundance of fullerenes in the interstellar medium is debated. According to Micelotta et al. (2012), fullerenes could also be generated in space from hydrogenated amorphous carbon (a-C:H). Under this scenario, UV irradiation leads to the aromatization of the aliphatic bridges to form pentagons which provide a route to fullerene formation in the solid phase. This route is suggested by earlier experiments of UV laser photo-chemical processing of a-C:H performed by Scott et al. (1997), although the dependence of the products with the UV flux corresponding to astrophysical environments could be further explored.
UV-induced chemistry may not be the only process at play. In particular, Garcia-Hernandez et al. (2010, 2011) have challenged our understanding of fullerene formation in space, showing that, contrary to general expectation, fullerenes (usually accompanied by PAH emission) are efficiently formed in H-rich circumstellar environments. To interpret the astronomical observations, Garcia-Hernandez et al. (2011) proposed that fullerenes could be formed from the destruction of a-C:H, possibly as a consequence of shocks driven by the fast stellar winds, which can sometimes be very strong in young PNe. The coexistence of a variety of molecular species supports the idea that fullerenes could be formed from the decomposition of a-C(:H).
Despite progress on the modeling of the amorphous carbon cycle and on the destruction routes of carbon-bearing molecules and small particles, many questions remain, in particular concerning the role of shocks, briefly evoked above. Shock waves are recognized to play an important role in the chemical and physical evolution of the interstellar medium. They are driven by cloud-cloud collisions, supersonic outflows from newly-forming stars, stellar winds, and supernova explosions from dying stars.
Shock waves compress, heat and accelerate the gas. Because of their inertia, the dust grains are not instantly accelerated but gradually entrained through collisions with the gas. The composition of a shocked interstellar gas, that is, the relative abundances of ionised, atomic or molecular hydrogen, depends upon the shock velocity and the pre-shock gas density. The range that we will explore in the present study lies in the H/H2 ratio of 0 to 0.8. The physical and chemical processes associated with the propagation of the shock wave include thermal sputtering, non-thermal sputtering due to the relative velocity difference between the gas and grains, shattering and sublimation. Shock processing of dust particles contributes to the recycling of refractory material and affects the grain size distribution (Jones et al. 1996). However, the detailed results of the models developed so far depend strongly on laboratory data such as grain shattering and grain charging (Guillet et al. 2011). The evolution of dust is driven by a great diversity of processes. This entanglement renders the investigation of dust evolution complex and has stimulated a number of scenarios (see e.g., Jones et al. 1996; Serra Diaz-Cano & Jones 2008; Slavin et al. 2015, and references therein).
 |
Fig. 1 Schematic diagram of the material shock tube (MST1). Helium is initially contained in the high pressure driver section whereas the driven section is filled with a low pressure mixture of argon and molecular hydrogen H2. The C60 powder is loaded onto the sample holder. |
For high-velocity shock waves (tens to hundreds of km s-1) in the low density interstellar medium (nH< 1 cm-3) and low-velocity shocks (tens of km s-1) in dense media (nH< 104−106 cm-3), knock-on sputtering dominates over thermal processing (Jones et al. 1996). For lower velocity shocks (~1–2 km s-1), typical of turbulent regions, thermal processing takes over and makes their investigation more accessible in the laboratory usingshock tubes, for example. Shock tubes can be employed for fast thermal processing of gases and materials. They represent an alternative to photon-induced heating methods. One of the advantages of shock tubes is that the gas temperature can be raised instantly by several thousands of K for durations of up to a number of milliseconds. This fast heating provides a common trigger of the decomposition or re-organization of unstable or fragile compounds at low temperatures. Moreover, high temperatures (above 2000 K), routinely reached in shock tubes, are very difficult to attain using conventional equipment (e.g., furnaces). During the shock, the pressure is raised by several orders of magnitude to reach tens of bars, far from the conditions encountered even in dense interstellar environments. At this high pressure, termolecular processes start competing with uni- and bi-molecular reactions. The high number of collisions ensures thermalization and promotes chemistry with the surrounding gas within a time accessible in the laboratory. Local thermodynamic equilibrium conditions are rapidly achieved, differing from that with interstellar clouds. In shocked media, radiative relaxation (through the emission of infrared photons) of large molecules and small particles may lead to temperatures that are significantly lower than that of the gas. With these reservations in mind, shock tubes can be considered a unique means to deposit energy at once in all the vibrational modes of a molecule or in the bulk of a particle, and to investigate chemical reactions at high temperature.
To the best of our knowledge there is only one study that has experimentally explored the evolution of C60 behind a shock wave. Their time dependent emission and absorption measurements have shown that C60 remains stable below 2650 K and that its decomposition leads to the generation of C2 (Sommer et al. 1996).
In the current work, we study the thermal processing of C60 crystalline particles in hydrogen over the gas temperature range between 783 and 4271 K through the ex situ analysis of the processed material and the post shock gas.Direct implantation of atoms in the target is negligible at the low collision energies (<1 eV) encountered in the shock tube. The solid residues have been collected after the shock and analyzed by imaging methods (Transmission Electron Microscopy and Scanning Electron Microscopy), by Infrared and Raman micro-spectroscopies, and by X-ray diffraction. The gaseous products have been analyzed by gas chromatography and cavity ring down spectroscopy. The association of all these physical and chemical methods sheds some light on the thermal processing of fullerenes in the presence of hydrogen.
2. Shock-wave processing of fullerenes
2.1. Shock tube arrangement
Shock tubes have been extensively used to generate shock waves in the laboratory for studies in the fields of combustion and chemical kinetics (Lifshitz 2005). Shock tubes are also employed to investigate the interaction of shock heated gases with materials, with applications for space vehicle re-entry.
The propagation of a shock wave in a gas leads to an abrupt, nearly discontinuous change in pressure, temperature and density of the medium. Shock tubes offer interesting characteristics. In particular, very rapid increases in temperature can be obtained (<0.1 μs) and typically maintained for a number of milliseconds. Additionally, temperature and pressure can be varied over a wide range. Wall effect contributions to the process in the adopted configurations are usually negligible.
The shock tube comprises two sections; the driver section, where the high pressure is built up, and the driven section, subjected to the shockwave, where the samples are placed. The outer and inner diameters of the shock tube are 115 and 80 mm, respectively. The length of the driver and driven sections are 2 and 5 m. The driver section is separated from the driven section by an aluminum diaphragm with thickness of between 2.5 and 4 mm. On the low pressure side of the diaphragm, grooves are cut along two perpendicular parting lines for a depth of approximately one quarter of its thickness to induce weakening points to provoke sudden diaphragm rupture. The thickness of the diaphragm determines the bursting pressure and it affects the shock strength accordingly. The material shock tube (MST1) employed here was specifically designed in the Shock Induced Materials Chemistry Lab, Indian Institute of Science, Bangalore, to study the interaction of materials in the form of fine powders with shock waves. The schematic diagram of the shock tube MST1 is shown in Fig. 1. A manually operated ball valve is placed 5m into the driven section. Immediately next to the valve, a powder sample holder is connected along with a 0.6 m long reaction chamber. The powder sample holder has a horizontal plate of 2 mm thickness, positioned at the centre of the cross section of the tube. The C60 fullerene powder (SES Research, 99.5% purity) to be exposed to the shock wave, is placed on the sample holder with loading amounts varying from 139 down to 13.9 μmol. The shock interacts with materials in the reaction chamber at the extremity of the driven section. This arrangement is made so that when the shock reaches the sample holder it interacts with the fine C60 powder along the reaction chamber with incident shock pressure (P2) and temperature (T2), and then with reflected shock pressure (P5) and temperature (T5).
A stainless steel gas cell, evacuated to high vacuum (10-6 mbar) beforehand using a turbo-molecular pump, is attached at the end flange of the reaction chamber to collect the gases produced during the interaction of shock waves with C60. As soon as the diaphragm bursts, the ball valve is closed. A gas outlet provided on the end flange enables the collection of post-shock volatile products into the gas cell. The gas cell is then taken for ex situ analysis of gases and solid residues collected from the sample section of the shock tube.
2.2. Shock tube experimental procedure
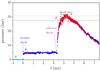 |
Fig. 2 Typical pressure trace recorded by the oscilloscope showing the arrival of primary and reflected shock waves and the expansion wave. |
After the aluminum diaphragm is mounted and the C60 powder deposited onto the sample holder, the driven section is evacuated down to 5 × 10⁻² mbar. The pumping is performed at a very slow rate so that the sample is not dispersed or pumped out. The tube is then flushed repeatedly with argon to render it clear of impurities or gas contaminants. The driven section is filled with a mixture of ultra high purity argon (99.9995%) and hydrogen (99.999%). Argon gas is filled into the driven section up to 0.2 bar and molecular hydrogen up to 0.04 bar so that the mixture of both the gases amounts to approximately 0.24 bar.
The desired parameters are approximately estimated before the shock. The shock velocity is then precisely determined after the rupture of the diaphragm for every experiment.The shock speed and reflected shock pressure are measured by dynamic pressure sensors (PCB Piezotronics model 113B22) mounted in the driven section of the shock tube. The three pressure sensors used are capable of measuring 345 bars for full scale output voltage of 5 V with a sensitivity of 14.5 mV/bar and a resolution of 1.4 mbar. Pressure traces, such as the one displayed in Fig. 2, were acquired and stored using a Tektronix oscilloscope (TDS2014B). The time differences between the incident shock rising fronts of the pressure traces (only one trace is displayed here) are used to determine the shock Mach number. The driver section is filled in with helium until the diaphragm bursts and generates the shock wave. The choice of the driver (He) and driven (Ar+H2) gases may seem reversed with respect to astrophysical scenario. In interstellar shocks, the dust is mainly subject to collisions with H/H2 and He. In shock tubes, for a given driver (P4) to driven (P1) pressure ratio, the normal shock strength depends on the speed of sound ratio a4/a1 which is proportional to (m1/m4)1/2 with m the mass of the gas. Therefore to reach high Mach number (M ≥ 4) with reasonable P4 pressures, we select mainly inert gases and use a lighter gas (He) for the driver section. The shock wave interacts with the C60 powder triggering a variety of chemical and physical processes between C60 and the shock heated Ar + H2 mixture inside the C60 reaction chamber.
The gas temperature Tg, is derived from chemical kinetics calculations performed with the shock tube module of Chemkin (2013) considering the experimentally measured velocity as an input parameter. The gas temperature is affected by the endothermicity of H2 dissociation, acting as a cooling mechanism. As a consequence, under our initial experimental conditions, the maximum gas temperature reached is Tg = 3869 K in pure Ar but only Tg = 3426 K (ΔT = −443 K) in an Ar/H2 mixture with a 10:1 ratio. Under the temperature conditions of most of the shock runs, a large fraction of molecular hydrogen is quickly dissociated into atomic H leading to typical H/H2 ratios of approximately 0.1 and up to 0.8. This leads to interesting chemistry as H is much more reactive than H2. Argon is an inert gas and its only role is to ensure the thermalization of the gas and of the particles.
The shock leads to the production of some hydrocarbon volatile species and of solid residues deposited inside the C60 reaction chamber. Only a few seconds after the diaphragm bursts, the ball valve is closed to limit diffusion of the driver gas (He) into the back end of the driven section. The gas present in the C60 reaction chamber is then expected to be poorly mixed with the He driver gas. It therefore primarily reflects the gas composition of the driven section. The gas in the C60 reaction chamber is slowly passed to the gas cell to a maximum of 2–3 bars pressure for ex situ analysis using GC and CRDS. The powder sample left inside the C60 reaction chamber (solid residue) is collected from the end flange and from the inner surface of the reaction chamber. To understand the physical and chemical mechanisms at play, the solid residue collected is investigated using XRD, SEM, TEM, Raman, and μ-FTIR.
3. Heating and sublimation of the carbonaceous particles
In the present experiments, the initial target sample is C60 micrometer sized crystalline solids. Several approaches were assessed for sublimating C60 particles but none gave a fully satisfactory outcome. We take advantage of the incident shock properties to sublimate C60. The calculations detailed below show in essence that behind the reflected shock, all the C60 particles <20 μm (the large majority, see Fig. 11a) are in the gas phase.
When the shock wave propagates in the gas seeded with solid particles, it disrupts the equilibrium of the mixture. The particle velocity and temperature decouple suddenly from the gas. As a consequence, it becomes essential to determine the particle temperature, Tp reached behind the shock. This is of key interest because this temperature governs most of the chemical and physical processes. Considering the difficulty of real-time particle temperature measurements, we built a 1D model following methods developed in previous studies (Roth & Fischer 1985; Reddy 1990). Because of the low particle concentration, we neglect particle-particle interactions as well as exchange processes on the gas properties.
We follow the approach adopted by Roth & Fischer (1985) to describe the behavior of a single particle in a gas bath. We write the conservation equations of mass, momentum and energy for a single particle of mass mp, radius xp and velocity vp. For simplicity, it is assumed that the particles are spherical and that the temperature across the whole of their volume is uniform.
The conservation of mass follows: ![\begin{equation} \frac{\rm d}{{\rm d}t}m_{\rm p} = - j = - 4\pi x_{\rm p} D \;{\rm \it Sh} \; \left[ {\rho_V(0) - \rho_V (\infty)} \right] , \end{equation}](/articles/aa/full_html/2017/03/aa29067-16/aa29067-16-eq34.png) (1)with D representing the binary diffusion coefficient of C60 vapor in argon (see Appendix), ρV(0) and ρV(∞) the volumetric mass densities of the vapor at the surface and far from the particle respectively, and Sh, the Sherwood number which represents the ratio of convective to diffusive mass transport. The Sherwood number is given by
(1)with D representing the binary diffusion coefficient of C60 vapor in argon (see Appendix), ρV(0) and ρV(∞) the volumetric mass densities of the vapor at the surface and far from the particle respectively, and Sh, the Sherwood number which represents the ratio of convective to diffusive mass transport. The Sherwood number is given by 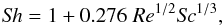 (2)with Sc, the Schmidt number defined as the ratio of momentum diffusivity (viscosity) and mass diffusivity Sc = η/ρD with η the dynamic viscosity. The volumetric mass density ρV(∞) of the vapor at infinity, far from the particle, is taken as equal to zero. At the surface it is calculated by considering that the gas pressure is equal to its vapor pressure PC60
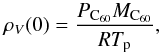 (3)where R is the ideal gas constant. For the fullerene vapor pressure PC60, we follow the sublimation curve up to the triple point at T = 1430 K, and then the vaporization curve according to expressions calculated by Fartaria et al. (2002). At T ~ 1900 K, the vapor pressure reaches a limit fixed by the gas pressure P5.
The conservation of momentum of a single particle can be written as: 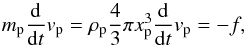 (4)with f the momentum flux from the particle to the surrounding gas given by:
 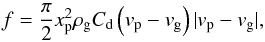 (5)with Cd the drag coefficient,
 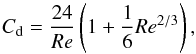 (6)and Re the Reynolds number,
 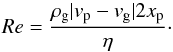 (7)We finally write the conservation of energy:
 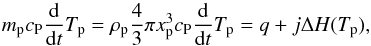 (8)with cp, the heat capacity at constant pressure of the particle, ΔH, the heat of phase change from solid or liquid to vapor, and q the heat flux which sums the contribution of two terms:
  (9)In that expression, Nu the Nusselt number is given by:
  (10)with Pr the Prandtl number,
  (11)with λ the gas conductivity and
  the gas heat capacity. In the absence of reported measurements for the emissivity of C60 particles (solely the emissivity of individual fullerenes has been determined), it is taken as being identical to graphite and given by the expression ϵ(T) = 0.2158 + 7.2013 × 10⁻⁴T/K−2.0742 × 10-7(T/K)2 (Neuer 1992). This assumption seems reasonable. At most, even considering ϵ(T) = 1, radiative cooling leads to a drop of ~20 K of the final temperature.
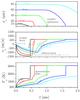 |
Fig. 3 1D simulation of the time evolution of the radius xp, velocity vp along the propagation axis, and temperature Tp of a single particle behind the incident and reflected shocks (Tg = 3135 K, M = 4.36) in pure Ar (P1 = 0.2 bar) in the laboratory. Calculations have been performed for initial radius of 10, 20, 40, 60, 80 μm. For illustration, the thermalization time for the 40 μm radius particle behind the reflected shock wave is indicated (380 μs). |
The resolution of these three coupled differential equations is performed for initial particle radii of 10 to 80 μm, a gas temperature of the reflected wave, Tg of 3135 K, considered as typical, and for a pure Ar gas. For computing considerations, we assume that below the diameter of 1 μm, the particle properties have reached the gas properties, that is, the gas temperature Tg. This is a reasonable assumption considering, for example, the energy consumed to reduce the radius of a particle from 10 μm to 0.5 μm compared to the supplementary energy four orders of magnitude smaller used to complete the sublimation. However, note that this differs from the situation encountered in interstellar shocks where the dust grains are not in thermal equilibrium with the post-shock gas. In Fig. 3, we clearly identify the two regimes corresponding to the incident and reflected shocks. The first observation is that the particle size xp remains quasi-constant behind the incident shock except for the lowest size xp(0) = 10μm for which it starts its marked decline only 150 μs after the incident shock. For 20 μm-radius particles, complete vaporization takes place in less than 60 μs after the reflected shock. For larger particles of initial radii of 40 and 60 μm, sublimation occurs after 380 μs and 900 μs, respectively. In the latter case, it becomes comparable to the dwell time. The temperature time evolution is closely correlated with particle size. Particles with initial radii larger than 80 μm do not attain the gas temperature within the shock duration. According to the simulations, only small C60 particles are vaporized and reach the gas temperature. Large ones lose superficial layers and only their surface is chemically exposed. Considering the micrometric size of the particle, we can nevertheless expect that their core is thermally processed.
In our experiments, the initial size of the particles lies in the micrometer size domain according to Scanning Electron Microscopy images (see Sect. 5.4) of unexposed particles. As a consequence, one can expect a large fraction of the particles to be sublimated within the shock duration.
4. Analysis of the gaseous products
4.1. Gas chromatography
Post shock mixtures were analyzed quantitatively using a Gas Chromatograph with a Flame Ionization Detector (GC-FID) and a Gas Chromatograph coupled to a Quadrupole Mass Detector (GC-MS). In both chromatographic analyses, a GS-GasPro capillary column of 60-m length was used. Helium and N2 were selected as carrier gases for GC-MS and GC-FID analyses, respectively. The carrier gas flow rate through the column in GC-FID was significantly higher (~26 cm3 min-1) than that in GC-MS (1 cm3 min-1) with oven temperatures maintained at 80 °C and 100 °C respectively. The gaseous products were collected and analyzed for different initial C60 amounts ranging from 13.9 to 139 μmol in a Ar/H2 (5:1) mixture. The reflected shock gas temperature Tg (simply referred to as gas temperature hereafter) derived under those conditions varies between 2800 K and 3000 K correlated to atomic H molar abundance of 4.5 to 6 mmol.
The analysis of post-shock mixtures confirms the formation of methane CH4, ethylene C2H4, acetylene C2H2, and ethane C2H6. Control experiments have been done without C60 and H2, with C60 but without H2 and with both C60 and H2 to ensure that the analyzed products are formed only in the presence of both under the given shock conditions. The GC chromatogram displayed on Fig. 4 shows that ethane is becoming eluted prior to ethylene and acetylene. After calibration of the chromatograms, we find that methane CH4 dominates, followed by ethylene C2H4, acetylene C2H2, and ethane C2H6 in a 20.3:7.0:1.7:1.0 ratio as can be inferred from Fig. 5. A marked rise in methane mole fraction (+50%) is observed over the 2800–3000 K temperature range as displayed in Fig. 5. Gas chromatograms also show that there is a strong positive correlation between the abundance of hydrocarbons and the C60 mole fraction for a given constant temperature of ~3100 K.
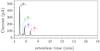 |
Fig. 4 Post shock GC chromatogram of volatile products collected after exposure of C60 to a shock wave (Tg = 3358 K, P5 = 23.2 bar, initial mixture: C60 = 0.01 g, H2 = 0.04 bar, Ar = 0.2 bar). |
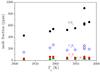 |
Fig. 5 Concentration of volatile hydrocarbons in the post-shock gas identified by GC-FID versus reflected shock gas temperature Tg and for C60 = 0.01 g. The experiments cover a H/H2 ratio in the 3.0 to 8.0% range, strongly correlated with Tg. |
The fragmentation pattern of C60, considered as a prototype for large molecular systems and the subject of many studies, can help to interpret the data. Past photophysics studies have shown that the fragmentation pathways will strongly depend on the internal energy of the fullerene (see Lebeault et al. 2012, and references therein). For fullerenes with low to moderate internal energy, fragmentation competes with ionization and proceeds dominantly via sequential neutral C2 loss. In cases of high internal energy, small size fragments with odd and even numbers of carbon atoms appear (see e.g., the work of Lykke 1995). Lebeault et al. (2012) showed that their origin is non-statistical, supporting a multi-fragmentation picture in which a broad variety of dissociation channels are open.
Following these considerations, the first steps of C60 decomposition after thermal excitation could be written as:  (12)According to nanosecond excitation experiments, the limit after which other routes must be considered is when x = 8, that is, C44 is produced. The C44 product and lower carbon species could decompose by loss of C, C2 and perhaps even larger fragments. The thermal stability study of C60 in a shock tube by Sommer et al. (1996) differs on that point by hinting that only the first step of decomposition gives a C2. They further conclude that C atoms are produced by the fast self reaction of C2 given below:
  (13)or alternately by the dissociation of C60 fragments. No compound with three carbon atoms is detected, suggesting the existence of decomposition pathways directly yielding C atoms. A possible explanation that can be put forward is that in thermalized hot environments, C60 can store a large amount of energy in its 174 vibrational modes, opening new fragmentation channels.Nonetheless, to account for the formation of the small hydrocarbons observed in our experiments, reactions of C and C2 with H/H2 suffice. As larger hydrocarbons or carbon fragments were not observed in our experiments, we could not probe other reaction pathways. Atomic C can react in a second step with molecular H2,
  (14)Once the CH radical is generated, the sequential addition of H2 continues with reaction products CHx (x = 1,2,3) to finally lead to methane CH4. The rate coefficients for all the steps of this sequential growth are high. The efficiency of this pathway will then depend on the availability of molecular hydrogen. At temperatures of the order of 3000 K, a large fraction of H2 will dissociate to give atomic H. However, the molecular hydrogen reservoir might be replenished by hot recombination of H on the surface.
The second most abundant hydrocarbon, ethylene, C2H4, is mainly formed through the reaction:  (15)with other alternative routes being non-competitive. By contrast, the chemical pathway to generate acetylene C2H2 starts directly from C2 and counts two steps:
  (16)followed by
  (17)Finally ethane C2H6 is produced in small amounts principally by the termolecular reaction:
  (18)Remarkably, no aromatic compound is identified. Yet, prolonged exposure of fullerenes to molecular hydrogen at moderate temperatures (673–723 K) leads to the formation of fulleranes C60Hx, followed by cage fragmentation and collapse of the cage structure accompanied by production of hydrocarbons, including PAHs (Talyzin et al. 2014). According to that study, the formation of PAHs is expected under high hydrogen conditions since any dangling bond that appears in the process of fullerene cage fragmentation will be immediately terminated by hydrogen. One interpretation of the absence of PAHs in the post-shock gas is that the elevated temperatures of the current set of experiments, which is expected to enhance the overall reactivity, does not compensate for the short duration of the exposure.
If we assume then that C60 gives away all its carbon, we should find 60 × [C60] /( [Ar] + [H2] ) ~ 3000 ppm equivalent C for initial concentration of [C60] of 14 μmol. At the temperature of 3000 K under our configuration, we measure a carbon content of ~1400 ppm, this translates into indicative C60 conversion yields of approximately 45%. The conversion of C60 to volatile hydrocarbons, that is, shell destruction followed by hydrogenation and chemical processing of the fragments, appears very efficient.
4.2. Cavity Ring Down spectroscopy
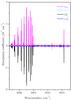 |
Fig. 6 Top: experimental CRD spectrum of the sampled gas collected after exposure to a shock wave (initial mixture: C60 = 139 μmol, Ar = 0.229 mol, H2 = 0.054 mol) with a reflected shock gas temperature Tg of 2996 K. Bottom: simulated spectrum of methane CH4 and ethylene C2H4 from the WKMC (Campargue et al. 2012) and ethylene linelists (Lyulin et al. 2014). The presence of residual water vapor is accounted for with the help of the Hitran 2012 database (Rothman et al. 2013). During the shock, a ratio of H/H2 ~ 0.068 is achieved. |
The collected gas was analyzed by a near IR continuous wave Cavity Ring Down Spectrometer operating in the 5950–6020 cm-1 range. The light source was provided by a set of telecom grade-fibered Distributed FeedBack diode lasers (DFB). Each of the DFB diodes (power of 5 to 20 mW) was covering approximately 7 nm (30 cm-1) by sweeping the temperature from −10 to 60 °C using a home-made PID stabilizer while injecting a constant pumping current. A fraction of the laser beam (10%) was sent into a wavemeter (Burleigh WA-1600) while the main part was injected into a high finesse optical cavity composed of two high reflectivity (R ≥ 99.997%), plano-concave (1000 mm radius of curvature) mirrors separated by approximately 800 mm. An optical isolator was protecting the DFB diodes from optical feedback. A single lens and two steering mirrors were used to mode-match the laser beam to the TEM00 mode of the optical cavity. The output mirror was mounted on a piezoelectrical transducer to modulate the length of the cavity. This allows a single optical cavity mode to be periodically set in resonance with the laser frequency. A second lens focuses the beam exiting the output mirror onto a InGaAs photodiode. Whenever the mode matching is achieved, the output intensity exceeds a threshold intensity then triggering an acousto-optical modulator (AOM) which, in turn, switches off the laser beam to let the photons evolve freely inside the cavity. The absorption coefficient is derived from the photon trapping time in the cavity. Approximately one hundred ring-down events were averaged for each wavelength in order to increase the signal to noise ratio. Ring-down events were sampled by a 16 bit, 1.25 MS/s analog-to-digital converter (PCI-6251). The maximum sensitivity achieved by the spectrometer corresponds to a minimum absorption coefficient of 5 × 10-11 cm-1. Each of the mirrors forming the high finesse cavity was mounted at one end of a stainless steel tube.
The cavity ring down spectra displayed on Fig. 6 were analyzed with the help of the Hitran 2012 database (Rothman et al. 2013), the WKMC line-list (Campargue et al. 2012) and an ethylene line-list (Lyulin et al. 2014). They reveal the presence of methane CH4, acetylene C2H2, and ethylene C2H4 in the gas sampled after exposure of 139 μmol of C60 to a shock wave in an Ar/H2 (5:1) mixture. The analysis of the data shows a clear, positive correlation between the total hydrocarbon production and temperature. We focus here on the ratio between the different volatiles which does not suffer from the scattering of the data points, itself being likely related to the sampling procedure. Figure 7 shows that the ethylene C2H4 to methane CH4 ratio is kept in a 0.3–0.6 range over a temperature interval varying from 2542 to 3084 K. Only a few spectra have been recorded over the spectral region over which acetylene C2H2 is optically active. The scarce data however displays a high C2H2/CH4 ratio of ~0.44, one order of magnitude higher than in the experiments analyzed by GC. In a first approximation, this discrepancy finds its source in the high initial C/H ratio (×10) in experiments analyzed by CRDS. Other small hydrocarbons such as ethane C2H6 go undetected in absence of reliable line-list in the investigated spectral range.
The sample size is too small to derive the temperature dependence of the C2H2/CH4 ratio. Of interest, the formation of hydrocarbons which originate from C60 decomposition, has already started at 2542 K, ~100 K lower than derived from the experiments of Sommer et al. (1996). At this temperature a small but measurable production of volatiles, less than 100 ppm for methane, is determined. Although our experiments are performed in a hydrogen bath, our findings apparently question the temperature threshold for decomposition. Small hydrocarbon production through the direct reaction of C60 with atomic H can be disregarded on the basis of relevant kinetic data. Subsequent shock tube measurements by Sommer & Roth (1998) indeed set a relatively low upper limit to the rate coefficient for the C60 + H reaction at 2300 K of 1.66 × 10⁻¹² cm3 molecule-1 s-1.
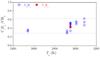 |
Fig. 7 Abundance ratios determined by CRDS of volatile products generated by the exposure of 139 μmol of C60 to a shockwave in a H2/Ar mixture (5:1) versus reflected shock gas temperature Tg. The experiments cover a H/H2 ratio in the 1.7 to 10% range, strongly correlated with Tg. |
5. Analysis of solid residues
5.1. infrared micro-spectroscopy
Infrared spectra were recorded using either a Nicolet Nicplan or a Continuum Fourier Transform infrared microscope, installed on the SMIS beam line of the SOLEIL synchrotron. Both spectrometers are equipped with a KBr beamsplitter and a nitrogen-cooled Mercury-Cadmium-Tellure (MCT) detector, operating over the 4000 to 650 cm-1 (2.5 to 15 μm) spectral range. The synchrotron radiation was used when high spatial resolution and intensity were required, whereas for larger samples the microscope conventional internal black-body-like source (Globar) was employed. The collected single beam spectra result from the average of 64 to 2048 individual scan acquisitions, with a spectral resolution set to 2 cm-1. The size of the area probed was typically 20 μm × 20 μm.
Particles as collected in the shock tube are agglomerated, which induces large scattering effects and large optical depth variations if measured as such. The carbonaceous solid residue samples were thus prepared by gently compressing them between two diamond windows, so that the interface is flattened and thinned to a few microns for transmission analysis. This procedure increases the quality of the spectral data by overcoming the above mentioned diffraction limitation and minimizing light scattering effects from particles of a global size similar to the wavelength of the observation.
The infrared spectra, displayed in Fig. 8, show a mixture of broad and sharp absorption features. We measured spectra of particles collected from the same shock, and they display a variability corresponding to different probed particles. The range of measured spectra within the same shock is displayed with the same color code on Fig. 8. This range of spectra reflects an inhomogeneity finding its origin in the differences in the initial size of the particles. Indeed, small particles will experience a hotter heat-wave than larger ones and will therefore end up more processed. This interpretation is supported by calculations of the particle heating and sublimation discussed above.
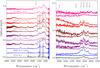 |
Fig. 8 Infrared absorption spectra of micrometric particles collected after exposure of fullerene C60 to a millisecond shock wave in an Ar/H2 mixture versus atomic H abundance and reflected shock gas temperature Tg. The baseline was corrected. The H/H2 ratio achieved during the shock of this set of experiments lies in the 0.0–0.8 range and correlates with the temperature Tg. |
The identification of the main peaks was performed with the help of past studies on carbon compounds. The infrared spectrum evolves from distinctive sharp features, with intense peaks centered at 1428 and 1182.6 cm-1 (7.0 and 8.46 μm) specific of C60 (lower spectrum), and associated with a tangential motion of the carbon atoms, to much broader components (upper spectra). Processed material exhibits an absorption band arising in the 2800–3000 cm-1 region (3.3–3.5 μm) and the observed CH contributions mostly correspond to aliphatic CH-stretching modes. These small features are accompanied by a broad component extending over the 900–1600 cm-1 region (6.25–10.0 μm). The 6.6–10 μm spectral region (1000–1500 cm-1), which reflects the activity of the CH bending motions and C−C stretching motions, is highly congested on our infrared spectrum. As the reflected shock gas temperature rises, the C60 absorption features progressively disappear at the benefit of this broad component which includes the characteristic sp2 C=C stretch. The position of the C=C stretching mode remains inside a 1571–1588 cm-1 window (6.30–6.36 μm). According to the study of laboratory soots performed by Pino et al. (2008), the aromatic versus aliphatic content of the material exhibits a clear correlation with the position of the C=C aromatic stretching mode. The band which lies at 6.2 μm in aromatic soots shifts to 6.3 μm when aliphatic CH stretch modes are observed. This evolution on the C=C stretch is associated with the structural defects induced by the presence of aliphatic carbon.
The presence of aliphatic carbon in the solid carbon residues is corroborated by the analysis of the 3.0–3.5 μm region. By contrast, none of the spectra displays the characteristic aromatic features of the CH stretch at 3.3 μm (3000–3100 cm-1). There is no absorption either at 3.04 μm (3300 cm-1), characteristic of acetylenic CH stretches. If the material structure remains largely aromatic, as traced by the relatively strong C=C absorption band, the H atoms are almost all bonded to sp3 C atoms. The structured bands lying between 3.29 and 3.57 μm (2800–3000 cm-1) can be decomposed into four aliphatic components (CH3 asymmetric mode, CH2 asymmetric mode with its wing, CH3 symmetric mode and CH2 symmetric mode with its wing), according to the procedure followed by Dartois et al. (2004). Considering the cross sections derived by Ristein et al. (1998) for the different sub-bands, we determined a CH2/CH3 ratio of 2.4 ± 1.2. We did not observe a correlation between this ratio and the atomic hydrogen content or the reflected shock gas temperature. The absence of direct information on the C/H ratio prevents us from identifying a specific region on the ternary phase diagram for carbon. Molecular hydrogen is initially present in excess in our experiments but the prominence of the CC bands on the infrared spectrum compared to the CH band in spite of the higher oscillator strength of the latter one suggests that the material is poorly hydrogenated. The comparison with the infrared spectra of laboratory a-C:H (Dartois et al. 2005), in which CH stretch dominates, supports this view.
We have also identified the presence of oxygen-bearing contaminants. Carbonyl stretches C=O are responsible for the absorption at 1710 cm-1 (5.84 μm) whereas the broad absorption at 3500 cm-1 (2.86 μm) is caused by adsorbed water or/and OH stretches. These bands are much more infrared active than the CH and C=C modes (by up to one or two orders of magnitude) and the level of oxygen contaminant is thus rather low.
The expected sub-structure is made of isolated poly-aromatic rings connected by aliphatic bridges. The measured CH2/CH3 ratio value implies that either these aliphatic chains are short, or that they are highly branched. The absence of significant contributions from aromatic and acetylenic CH stretching mode in the IR spectrum, and the dominating CH2/CH3 contribution suggest that most aliphatic bridges are saturated. There is no H atom directly bound to the aromatic rings.
5.2. Raman micro-spectroscopy
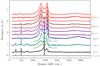 |
Fig. 9 Raman spectra of micrometric particles collected after exposure of C60 to a millisecond shock wave in an Ar/H2 mixture versus reflected shock gas temperature Tg. The baseline was corrected. The sharp features are assigned to C60. For comparison, the Raman spectra of unexposed C60 (lower trace, this work) and of prolonged heat treated C60 in Ar flow at 1100 and 1800 K recorded by Mochida et al. (1997) are provided. |
Raman micro-spectroscopy was performed at the SMIS beamline at SOLEIL using a DXR Raman micro-spectrometer from Thermo Fisher with a 532 nm exciting laser radiation (Fig. 9). The laser power received by the sample was kept lower than 0.3 mW, producing power densities lower than 300 W/mm2. We recorded Raman maps of different locations with a spectral resolution of 4 cm-1 and a spatial resolution of approximately 1 μm. Before shock exposure, the Raman spectrum of C60 exhibits intense peaks at 1465 and 1570 cm-1 which are assigned to the pentagonal pinch vibration of the five-membered ring and to the ring deformation of the six-membered ring, respectively (Eklund et al. 1992). After shock exposure, we observe a great variability between Raman spectra of individual particles collected in the same run similarly to the infrared measurements. As the reflected shock gas temperature is raised, the Raman spectra clearly show the transition from C60 with its distinctive sharp peaks to disordered carbon with two typical broad structures centered around 1350 and ~1600 cm-1 and assigned to the D and G peaks. The so-called graphitic or G peak is due to the bond stretching of all pairs of sp2 atoms in both rings (aromatic) and chains (olefinic). The defect or D peak is due to the breathing modes of sp2 atoms in rings. The relative peak sizes and full widths at half maximum (FWHMs) of the D and G peaks reflect the degree of disorder of the material (broader lines corresponding to more disordered material).
In the Raman spectra evolution with shock intensity, we first observed a gradual reduction of the intensity of the 1465 cm-1 sharp peak with the temperature, interpreted as the cracking of the pentagonal ring, which initiates the collapse of the molecular structure of C60. The smaller 1570 cm-1 band also progressively diminishes with the reflected shock gas temperature before completely disappearing above 3400 K, suggesting the loss of the spherical structure. Mochida et al. (1997) showed that the cage structure of C60 breaks down at approximately 1200 K in line with our measurements in which the first spectral changes appear as low as 800 K.
The broad features of the Raman spectra were analyzed using a combination of Lorentzian-shaped and a Gaussian-shaped bands (G, D1, D2, D3, D4), following the approach developed by Sadezky et al. (2005) for the analysis of soot and related carbonaceous material. The D1 sub-band is the most intense feature centered at ~1330 cm-1. We determine a clear (but moderate) positive correlation between the D1/G height ratio and the reflected shock gas temperature Tg in spite of the gap in the data over the 800–2500 K interval. Despite large variability between spectra, we only observe an average increase of the relative D1/G ratio of a factor of ~1.5 ± 1 over the 3000–3400 K range. The position of the G band varies between 1548 and 1594 cm-1, uncorrelated with the reflected shock gas temperature. The quasi constant width of the G band, suggests that after opening of the cage, the growth of the structures is limited, probably because of a lack of time for further reactivity to proceed. The structure could correspond to discrete fragments of curved carbon sheets, in which pentagons and heptagons are dispersed randomly throughout networks of hexagons (Harris & Tsang 1997).
The spectrum obtained after exposure to a millisecond long shock wave for reflected shock gas temperatures of ~3000 K is comparable to the one measured by Mochida et al. (1997) after long duration heat treatment of fullerenes at 1100 K. The peaks are broad and the G band dominates. Above 3000 K, the D and G peaks get sharper as hexagonal planes start stacking and the spectra look very similar to the one recorded by Mochida for prolonged heat treatment at 1800 K. Under our experimental conditions, and unlike classical heat treatment, the particles experience the high temperature of the shock for a very brief time; of the order of a millisecond. This picture becomes even worse when considering the time required by the particle to reach the gas temperature as we have shown in Sect. 3. The combination of the two phenomena explains the level of processing observed.
5.3. X-ray diffraction
X-ray diffraction is commonly used to characterize the structural details of solid-state substances. It has been proven powerful for studying disordered materials which are inherently heterogeneous, yielding an estimation of average property. The powder X-ray diffraction (XRD) pattern of pristine and shock processed C60 were recorded using Cu Kα radiation at a scan rate of 0.250° min-1 with 0.010° min-1 incremental steps in the 2θ range between 5° to 90° (PANalytical Empyrean). The XRD pattern of pristine C60 molecules before shock exposure are close-packed in a face-centered cubic (fcc) structure (a = 14.166 Å) at room pressure and temperature. The diffraction pattern with hkl value are indexed to (111), (220), (311), (222), (331), (420), (422) and (511) (JCPDS no. 44-0558) as shown in Fig. 10a. A rough crystallite size of Lc = 47 nm is derived applying the Scherrer equation, Lc = λ/βcos(θ), with λ, the radiation wavelength, β, the full width at half maximum of the (111) peak located at 2θ = 10.75°.
The exposure of C60 fine powder to a shock wave in a 5:1 Ar/H2 mixture (Tg ~ 3140 K) leads to a drastic reduction (×1/50) of the intensity of the diffraction lines corresponding to the fcc structure and to a strong line broadening by approximately 70% as shown in Fig. 10b. These changes are accompanied by the appearance of a broad component centered at approximately 25° and another at the shortest angle measured. This behavior is even more pronounced for lower initial mole fractions of C60 with similar reflected shock gas temperature (Tg ~ 3110 K) as shown in Fig. 10c. The broad structures reflect the amorphous nature of the end-products, typical of disordered carbons. This translates into a crystallite size of ~0.73 nm after shock exposed C60. The peaks appearing at 38.3°, 44.6°, 64.9° and 78.3° angles after shock exposure are due to aluminum impurities from the ruptured diaphragm. As the X-ray diffraction Al lines are very intense, the small signals correspond to weak contamination levels, most probably associated with the retrieval of the samples and not directly related to the metallic diaphragm rupture. There was no trace of Al under the microscope or on the SEM and TEM images (see below). As a consequence, we can safely assume that the effects of aluminum on the processing of C60, if any, are negligible.
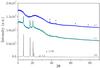 |
Fig. 10 X-ray diffraction powder pattern of (a) pristine C60; (b) Shock exposed 139 μmol C60; (c) Shock exposed 104 μmol C60. The stars indicate metal alloy contribution from the aluminum ruptured diaphragm. |
5.4. Scanning electron microscopy
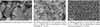 |
Fig. 11 SEM images of pristine and shock processed C60 particles. |
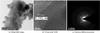 |
Fig. 12 High resolution transmission electron microscope images of pristine C60 particles. |
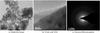 |
Fig. 13 High resolution transmission electron microscope images of shock processed C60 particles (34.7 μmol) at Tg = 3093 K in a 5:1 Ar/H2 mixture. |
Scanning electron microscope (FEI SIRION XL30 FEG SEM) was used to study the morphology of C60 and its solid residues after exposure to strong shock waves. SEM micrographs of C60 fine powder before and after shock exposure in Ar/H2 gas mixtures were recorded. Figure 11a at 100 000 × magnification of unexposed C60 powder shows large blocks corresponding to micrometer sized crystals with smaller fragments of a few hundred nm. The initial particle size is typically three orders of magnitude larger than typical interstellar carbonaceous grains with a size distribution peaking at 0.2 μm (Draine 2003). After exposure to shock heated Ar/H2 gas mixture at Tg = 3144 K, the picture becomes totally different. Exposed C60 forms spherical particles, with an average size in the 50 nm range for initial C60 mole fraction of 139 μmol (Fig. 11b). Exposure of lower initial C60 mole fraction (Fig. 11c) to similar gas temperatures (Tg = 3070 K) leads to smaller end-products, some of them agglomerated with an average size of 30 nm.
The SEM images of shock processed C60 particles where analyzed using in-house software. The shock processed C60 images were convolved with a filter representing the SEM response of the individual spherical particles (bright rim, extracted on an accurately measured particle in the images) of a varying and prescribed diameter. A detection threshold was set to count the number of such particles in bins of 10 to 200 nm. Although the superposition of particles is not thoroughly taken into account in such a simple deconvolution method, the histogram peaks show an asymmetry characteristic of a log-normal distribution. The spherical shape of the particles and the log-normal size distribution trace back to complete sublimation followed by condensation of the C60 vapor in the colder, post-shock phase. The difference in size observed for different initial C60 mole fractions is directly related to the density of C60 in the vapor phase. In the case of low density, the growth of each nucleation site is rapidly stopped by lack of molecular C60. Coagulation is limited as the nucleation centers are distant. The sharp log-normal distribution reflects this homogeneous nucleation process. For higher densities, growth is sustained for longer times as the available C60 molecules are more abundant. The probability of collisions between neighboring nucleation centers is also enhanced leading to agglomerated particles and broader size distribution.
The SEM images suggest that most of C60 is vaporized by the shock and as a consequence experiences the reflected shock gas temperature. It puts, therefore, a constraint on the particle initial upper size of ~120 μm as it takes approximately 1 ms, that is, approximatively the typical shock duration, for such particles to achieve complete vaporization/sublimation as shown by simulations summarized in Fig. 3.
5.5. Transmission electron microscopy
High resolution transmission electron microscopy (HRTEM) was employed to investigate the crystalline nature of the carbon samples at the nanometer scale. The HRTEM (FEI, F30) was operated at 300 kV. Samples for TEM were prepared using dilute suspensions of C60 powder before shock loading and the solid residues collected after shock exposure. The solutions obtained by sonicating particles in acetone for 20 min were then dropped onto separate TEM carbon-coated 300 mesh copper grids. TEM grids were exposed to infrared heating for several hours before mounting for outgassing. The studies were carried out on pristine C60 and shock-exposed samples suspended on separate carbon grids. Exposure time was controlled to prevent processing of the sample by the high energy electrons.
Bright field, HRTEM image and electron diffraction pattern of unexposed C60 are provided on Fig. 12. Bulk fullerene at room temperature displays a closely packed stable fcc crystal structure plane. The bright field image shows agglomerated C60 particles of 50 nm size in agreement with the X-ray diffraction analysis. HRTEM images show lattice fringe spacing of 7.41 Å which correspond to the size of C60. The selected area electron diffraction pattern of the crystalline structure of C60 is also shown.
The shock-induced phase transformation of C60 from fcc to amorphous carbon is confirmed by Fig. 13. The bright field image shows spherical particles of different sizes from 20 nm to 200 nm. Very little lattice fringes remain on the HRTEM images which suggests a disordered and isotropic structure consisting of tightly curled single carbon layers, with no obvious graphitization. The selected area electron diffraction pattern of shock exposed C60 exhibits diffuse and symmetrical rings, due to the amorphous nature of the material and confirms the isotropic structure.
6. Summary and conclusions
Fullerene solids were exposed to shock waves in a mixture of inert gas and hydrogen employing a shock tube. Temperatures slightly above 3000 K have been explored, leading to fragmentation of C60 and dissociation of hydrogen with a typical H/H2 ratio of 0.1 and up to 0.8. The resulting rich chemistry led to the generation of volatile products and solid residues which have been examined by a combination of analytical methods to achieve some insight into the processes at play and the end-products. The heterogeneity of the results reflects the particle size distribution and the chemical kinetics of the reactions involved (H2 dissociation, C60 decomposition, hydrocarbon formation) which are non-linear: small differences in the initial conditions may lead to significant changes in the end-products. The post shock gas phase analysis demonstrates the production of four hydrocarbons, CH4> C2H4> C2H2> C2H6 above temperatures of 2540 K. No larger species, including aromatics, are observed. The formation of these molecular species correlates with reflected shock gas temperature Tg and initial C60 mole fraction. Former investigations have shown that C2 was the main fragment produced by C60 decomposition. The chemical analysis highlights the key role played onwards by the C2 radical in hydrocarbon formation through the substantial presence of molecules containing two carbon atoms. However, the concurrent presence of large amounts of methane CH4 and the absence of three carbon molecular species hint at the existence of competing fragmentation channels yielding directly single C atoms. Most of the identified gas-phase mechanisms are uni-and bi-molecular processes. Only a limited number of the processes at play appear to be termolecular (A+B+M→C+D+M).
The infrared spectra of the solid residues indicate that C60 is converted by the shock into a disordered material, with few aliphatic chains bridging sp2 and sp3 carbons of the backbone structure. The infrared spectra point to a hydrogen-poor carbonaceous material. Without a value for the C/H ratio, a more precise determination of the type of the carbonaceous material remains elusive. The measured Raman spectra are typical of non-graphitizing carbons, suggesting collapse of the cages. The Raman G band suggests a crystallite coherence length well below 10 nm for this amorphous phase. The spectra hint to the presence of randomly arranged, non-stacked, hexagonal planes. X-ray diffraction spectra offer evidence of the transition to highly amorphous carbon. This interpretation is supported by TEM which exposes a highly disordered and isotropic structure.
The log-normal distribution of the size of the exposed particles extracted from images obtained by SEM attest to the fact that most of the material is sublimated by the shock.
Low velocity shocks (1–2 km s-1) are capable of strongly modifying the structure of fullerenes. This work could find some applications for interstellar shock processing of fullerene-containing dust particles. This could also be of interest for meteorites in which fullerenes have been identified by some authors (Becker et al. 1999; Heymann et al. 2003), but for which the abundance is still highly debated.
The conclusions drawn from this study present limitations for a direct applicability to interstellar molecular species. In the interstellar medium, there are few collisional partners to remove the excess energy deposited in the target by another molecule, an ion, an electron or a UV photon. Radiative relaxation by infrared vibrational emission plays a major role in those rarefied environments. For very large molecules or solids, direct applications to shock induced chemistry in astrophysical environments are more relevant as the energy can be readily dissipated in the bulk.
Further studies will focus on thermal processing of other types of carbons by shock waves. In particular, there is strong interest in probing the scenario of the formation of PAHs from amorphous hydrogenated carbon, considered as an important component of carbon in the interstellar medium.
This work extends our previous attempts to employ original reactors to synthesize (or alter) interstellar dust analogs (Biennier et al. 2009). The current investigation opens the way to a more systematic use of shock tubes in astrophysical applications.
Acknowledgments
This research was supported by the CNRS-INSU Programme National de Physique Stellaire, the CNRS-INSU Programme de Physique et Chimie du Milieu Interstellaire, and the Indo-French Center for the Promotion of Advanced Research (CEFIPRA/IFCPAR) under project N° 4905-C. Jonathan Courbe is thanked for the mechanical design of the C60 sample holder. Some of the experiments were performed on the SMIS beamline at SOLEIL Synchrotron, France. We are grateful to Christophe Sandt and Ferenc Borondics for their supportive assistance at the SMIS beamline. We finally thank the referee who greatly contributed to improvement of the manuscript.
References
- Becker, L., Bunch, T. E., & Allamandola, L. J. 1999, Nature, 400, 227 [NASA ADS] [CrossRef] [Google Scholar]
- Berné, O., & Tielens, A. G. G. M. 2012, Proc. Nat. Acad. Sci., 109, 401 [Google Scholar]
- Berné, O., Montillaud, J., & Joblin, C. 2015, A&A, 577, A133 [NASA ADS] [CrossRef] [EDP Sciences] [Google Scholar]
- Biennier, L., Georges, R., Chandrasekaran, V., et al. 2009, Carbon, 47, 3295 [CrossRef] [Google Scholar]
- Bocchio, M., Jones, A. P., & Slavin, J. D. 2014, A&A, 570, A32 [NASA ADS] [CrossRef] [EDP Sciences] [Google Scholar]
- Bunz, U., Rubin, Y., & Tobe, Y. 1999, Chem. Soc. Rev., 28, 107 [CrossRef] [Google Scholar]
- Cami, J., Bernard-Salas, J., Peeters, E., & Malek, S. E. 2010, Science, 329, 1180 [NASA ADS] [CrossRef] [PubMed] [Google Scholar]
- Campargue, A., Wang, L., Mondelain, D., et al. 2012, Icarus, 219, 110 [NASA ADS] [CrossRef] [Google Scholar]
- Campbell, E. K., Holz, M., Gerlich, D., & Maier, J. P. 2015, Nature, 523, 322 [NASA ADS] [CrossRef] [PubMed] [Google Scholar]
- Chemkin. 2013, Reaction Workbench 15131, Reaction Design: San Diego, 2013 [Google Scholar]
- Chuvilin, A., Kaiser, U., Bichoutskaia, E., Besley, N. A., & Khlobystov, A. N. 2010, Nat. Chem., 2, 450 [NASA ADS] [CrossRef] [Google Scholar]
- Dartois, E., Munoz Caro, G. M., Deboffle, D., & d’Hendecourt, L. 2004, A&A, 423, L33 [NASA ADS] [CrossRef] [EDP Sciences] [Google Scholar]
- Dartois, E., Caro, G. M. M., Deboffle, D., Montagnac, G., & d’Hendecourt, L. 2005, A&A, 432, 895 [NASA ADS] [CrossRef] [EDP Sciences] [Google Scholar]
- Draine, B. T. 2003, ARA&A, 41, 241 [NASA ADS] [CrossRef] [Google Scholar]
- Dunk, P. W., Kaiser, N. K., Hendrickson, C. L., et al. 2012, Nat. Commun., 3, 855 [NASA ADS] [CrossRef] [Google Scholar]
- Dwek, E., Foster, S. M., & Vancura, O. 1996, ApJ, 457, 244 [NASA ADS] [CrossRef] [Google Scholar]
- Eklund, P. C., Ping, Z., Kai-An, W., Dresselhaus, G., & Dresselhaus, M. S. 1992, J. Phys. Chem. Solids, 53, 1391 [NASA ADS] [CrossRef] [Google Scholar]
- Fartaria, R. P. S., Fernandes, F. M. S. S., & Freitas, F. F. M. 2002, J. Phys. Chem. B, 106, 10227 [CrossRef] [Google Scholar]
- Ferrarotti, A. S., & Gail, H.-P. 2006, A&A, 447, 553 [NASA ADS] [CrossRef] [EDP Sciences] [Google Scholar]
- Garcia-Hernandez, D. A., Manchado, A., Garcia-Lario, P., et al. 2010, ApJ, 724, L39 [NASA ADS] [CrossRef] [Google Scholar]
- Garcia-Hernandez, D. A., Iglesias-Groth, S., Acosta-Pulido, J. A., et al. 2011, ApJ, 737, L30 [NASA ADS] [CrossRef] [Google Scholar]
- Garcia-Hernandez, D. A., Villaver, E., Garcia-Lario, P., et al. 2012, ApJ, 760, 107 [NASA ADS] [CrossRef] [Google Scholar]
- Guillet, V., Pineau des Forêts, G., & Jones, A. P. 2011, A&A, 527, A123 [NASA ADS] [CrossRef] [EDP Sciences] [Google Scholar]
- Harris, P. J. F., & Tsang, S. C. 1997, Philosophical Magazine A, 76, 667 [NASA ADS] [CrossRef] [Google Scholar]
- Heath, J. R. 1991, ACS Symp. Ser., 481, 1 [CrossRef] [Google Scholar]
- Heymann, D., Jenneskens, L. W., Jehlička, J., Koper, C., & Vlietstra, E. 2003, Fullerenes, Nanotubes and Carbon Nanostructures, 11, 333 [CrossRef] [Google Scholar]
- Irle, S., Zheng, G., Wang, Z., & Morokuma, K. 2006, J. Phys. Chem. B, 110, 14531 [CrossRef] [PubMed] [Google Scholar]
- Jäger, C., Huisken, F., Mutschke, H., Jansa Llamas, I., & Henning, T. 2009, ApJ, 696, 706 [NASA ADS] [CrossRef] [Google Scholar]
- Jones, A., Tielens, A., & Hollenbach, D. 1996, ApJ, 469, 740 [NASA ADS] [CrossRef] [Google Scholar]
- Kratschmer, W., Lamb, L. D., Fostiropoulos, K., & Huffman, D. R. 1990, Nature, 347, 354, [NASA ADS] [CrossRef] [Google Scholar]
- Kroto, H., Heath, J., O’Brien, S. C., Curl, R. F., & Smalley, R. E. 1985, Nature, 318, 162 [NASA ADS] [CrossRef] [Google Scholar]
- Lebeault, M.-A., Baguenard, B., Concina, B., et al. 2012, J. Chem. Phys., 137 [Google Scholar]
- Lifshitz, A. 2005, in The single pulse shock tube: its Odyssey in chemical kinetics, ed. Z. Jiang (Berlin Heidelberg: Springer), 57 [Google Scholar]
- Lykke, K. R. 1995, Phys. Rev. A, 52, 1354 [NASA ADS] [CrossRef] [Google Scholar]
- Lyulin, O. M., Mondelain, D., Béguier, S., et al. 2014, Mol. Phys., 112, 2433 [NASA ADS] [CrossRef] [Google Scholar]
- Matsuura, M., Woods, P. M., & Owen, P. J. 2013, MNRAS, 429, 2527 [NASA ADS] [CrossRef] [Google Scholar]
- Micelotta, E. R., Jones, A. P., & Tielens, A. G. G. M. 2010a, A&A, 510, A37 [NASA ADS] [CrossRef] [EDP Sciences] [Google Scholar]
- Micelotta, E. R., Jones, A. P., & Tielens, A. G. G. M. 2010b, A&A, 510, A36 [NASA ADS] [CrossRef] [EDP Sciences] [Google Scholar]
- Micelotta, E., Jones, A., Cami, J., et al. 2012, ApJ, 761, 35 [NASA ADS] [CrossRef] [Google Scholar]
- Mochida, I., Egashira, M., Korai, Y., & Yokogawa, K. 1997, Carbon, 35, 1707 [CrossRef] [Google Scholar]
- Neuer, G. 1992, Eurotherm seminar 27 Quantitative Infrared Thermography, 7-9 July (Paris: France), 27, 1 [Google Scholar]
- Pino, T., Dartois, E., Cao, A.-T., et al. 2008, A&A, 490, 665 [CrossRef] [EDP Sciences] [Google Scholar]
- Poling, B. E., Prausnitz, J. M., & O’Connell, J. 2007, in The Properties of Gases and Liquids, 5th edn. (Englewood Cliffs: McGraw-Hill Professional) [Google Scholar]
- Reddy, K. P. J. 1990, J. Appl. Phys., 67, 3565 [NASA ADS] [CrossRef] [Google Scholar]
- Ristein, J., Stief, R. T., Ley, L., & Beyer, W. 1998, J. Appl. Phys., 84, 3836 [NASA ADS] [CrossRef] [Google Scholar]
- Roberts, K. R. G., Smith, K. T., & Sarre, P. J. 2012, MNRAS, 421, 3277 [NASA ADS] [CrossRef] [Google Scholar]
- Roth, P., & Fischer, R. 1985, Physics of Fluids (1958–1988), 28, 1665 [NASA ADS] [CrossRef] [Google Scholar]
- Rothman, L. S., Gordon, I. E., Babikov, Y., et al. 2013, J. Quant. Spectr. Rad. Transf., 130, 4 [Google Scholar]
- Sadezky, A., Muckenhuber, H., Grothe, H., Niessner, R., & Pöschl, U. 2005, Carbon, 43, 1731 [CrossRef] [Google Scholar]
- Scott, A., Duley, W. W., & Pinho, G. P. 1997, ApJ, 489, L193 [NASA ADS] [CrossRef] [Google Scholar]
- Sellgren, K., Werner, M. W., & Ingalls, J. G. 2009, The 5–15 Micron Spectrum of Reflection Nebulae as a Probe for Fullerenes [Google Scholar]
- Sellgren, K., Werner, M. W., Ingalls, J. G., et al. 2010, ApJ, 722, L54 [NASA ADS] [CrossRef] [Google Scholar]
- Serra Diaz-Cano, L., & Jones, A. P. 2008, A&A, 492, 127 [NASA ADS] [CrossRef] [EDP Sciences] [Google Scholar]
- Slavin, J. D., Dwek, E., & Jones, A. P. 2015, ApJ, 803, 7 [NASA ADS] [CrossRef] [Google Scholar]
- Smalley, R. E. 1992, Accounts Chem. Res., 25, 98 [CrossRef] [Google Scholar]
- Sommer, T., & Roth, P. 1998, J. Phys. Chem. A, 102, 3083 [CrossRef] [Google Scholar]
- Sommer, T., Kruse, T., & Roth, P. 1996, J. Phys. B: At. Mol. Opt. Phys., 29, 4955 [NASA ADS] [CrossRef] [Google Scholar]
- Talyzin, A. V., Luzan, S., Anoshkin, I. V., et al. 2014, J. Phys. Chem. C, 118, 6504 [CrossRef] [Google Scholar]
- Zhen, J., Castellanos, P., Paardekooper, D., Linnartz, H., & Tielens, Alexander, G. G. M. 2014, ApJ, 797, L30 [NASA ADS] [CrossRef] [Google Scholar]
- Zhukovska, S., Gail, H.-P., & Trieloff, M. 2008, A&A, 479, 453 [NASA ADS] [CrossRef] [EDP Sciences] [Google Scholar]
Appendix A: Molecular diffusion of C60 in Ar
The molecular diffusion of C60 in argon can be written as Poling et al. (2007) (A.1)where P is the pressure, μ the reduced mass,
  the collision cross section and ΩD the collision integral which can be computed with the Neufield et al. (1972) interpolation formula (see Poling et al. 2007, p. 11.6) employing the following Lennard-Jones’ parameters: ϵAr/k = 124 K and ϵC60/k = 33.16 K; σAr = 3.42 Åand σC60 = 3.89 Å .
All Figures
|
Fig. 1 Schematic diagram of the material shock tube (MST1). Helium is initially contained in the high pressure driver section whereas the driven section is filled with a low pressure mixture of argon and molecular hydrogen H2. The C60 powder is loaded onto the sample holder. |
| In the text | |
|
Fig. 2 Typical pressure trace recorded by the oscilloscope showing the arrival of primary and reflected shock waves and the expansion wave. |
| In the text | |
|
Fig. 3 1D simulation of the time evolution of the radius xp, velocity vp along the propagation axis, and temperature Tp of a single particle behind the incident and reflected shocks (Tg = 3135 K, M = 4.36) in pure Ar (P1 = 0.2 bar) in the laboratory. Calculations have been performed for initial radius of 10, 20, 40, 60, 80 μm. For illustration, the thermalization time for the 40 μm radius particle behind the reflected shock wave is indicated (380 μs). |
| In the text | |
|
Fig. 4 Post shock GC chromatogram of volatile products collected after exposure of C60 to a shock wave (Tg = 3358 K, P5 = 23.2 bar, initial mixture: C60 = 0.01 g, H2 = 0.04 bar, Ar = 0.2 bar). |
| In the text | |
|
Fig. 5 Concentration of volatile hydrocarbons in the post-shock gas identified by GC-FID versus reflected shock gas temperature Tg and for C60 = 0.01 g. The experiments cover a H/H2 ratio in the 3.0 to 8.0% range, strongly correlated with Tg. |
| In the text | |
|
Fig. 6 Top: experimental CRD spectrum of the sampled gas collected after exposure to a shock wave (initial mixture: C60 = 139 μmol, Ar = 0.229 mol, H2 = 0.054 mol) with a reflected shock gas temperature Tg of 2996 K. Bottom: simulated spectrum of methane CH4 and ethylene C2H4 from the WKMC (Campargue et al. 2012) and ethylene linelists (Lyulin et al. 2014). The presence of residual water vapor is accounted for with the help of the Hitran 2012 database (Rothman et al. 2013). During the shock, a ratio of H/H2 ~ 0.068 is achieved. |
| In the text | |
|
Fig. 7 Abundance ratios determined by CRDS of volatile products generated by the exposure of 139 μmol of C60 to a shockwave in a H2/Ar mixture (5:1) versus reflected shock gas temperature Tg. The experiments cover a H/H2 ratio in the 1.7 to 10% range, strongly correlated with Tg. |
| In the text | |
|
Fig. 8 Infrared absorption spectra of micrometric particles collected after exposure of fullerene C60 to a millisecond shock wave in an Ar/H2 mixture versus atomic H abundance and reflected shock gas temperature Tg. The baseline was corrected. The H/H2 ratio achieved during the shock of this set of experiments lies in the 0.0–0.8 range and correlates with the temperature Tg. |
| In the text | |
|
Fig. 9 Raman spectra of micrometric particles collected after exposure of C60 to a millisecond shock wave in an Ar/H2 mixture versus reflected shock gas temperature Tg. The baseline was corrected. The sharp features are assigned to C60. For comparison, the Raman spectra of unexposed C60 (lower trace, this work) and of prolonged heat treated C60 in Ar flow at 1100 and 1800 K recorded by Mochida et al. (1997) are provided. |
| In the text | |
|
Fig. 10 X-ray diffraction powder pattern of (a) pristine C60; (b) Shock exposed 139 μmol C60; (c) Shock exposed 104 μmol C60. The stars indicate metal alloy contribution from the aluminum ruptured diaphragm. |
| In the text | |
|
Fig. 11 SEM images of pristine and shock processed C60 particles. |
| In the text | |
|
Fig. 12 High resolution transmission electron microscope images of pristine C60 particles. |
| In the text | |
|
Fig. 13 High resolution transmission electron microscope images of shock processed C60 particles (34.7 μmol) at Tg = 3093 K in a 5:1 Ar/H2 mixture. |
| In the text | |
Current usage metrics show cumulative count of Article Views (full-text article views including HTML views, PDF and ePub downloads, according to the available data) and Abstracts Views on Vision4Press platform.
Data correspond to usage on the plateform after 2015. The current usage metrics is available 48-96 hours after online publication and is updated daily on week days.
Initial download of the metrics may take a while.