Fig. 9
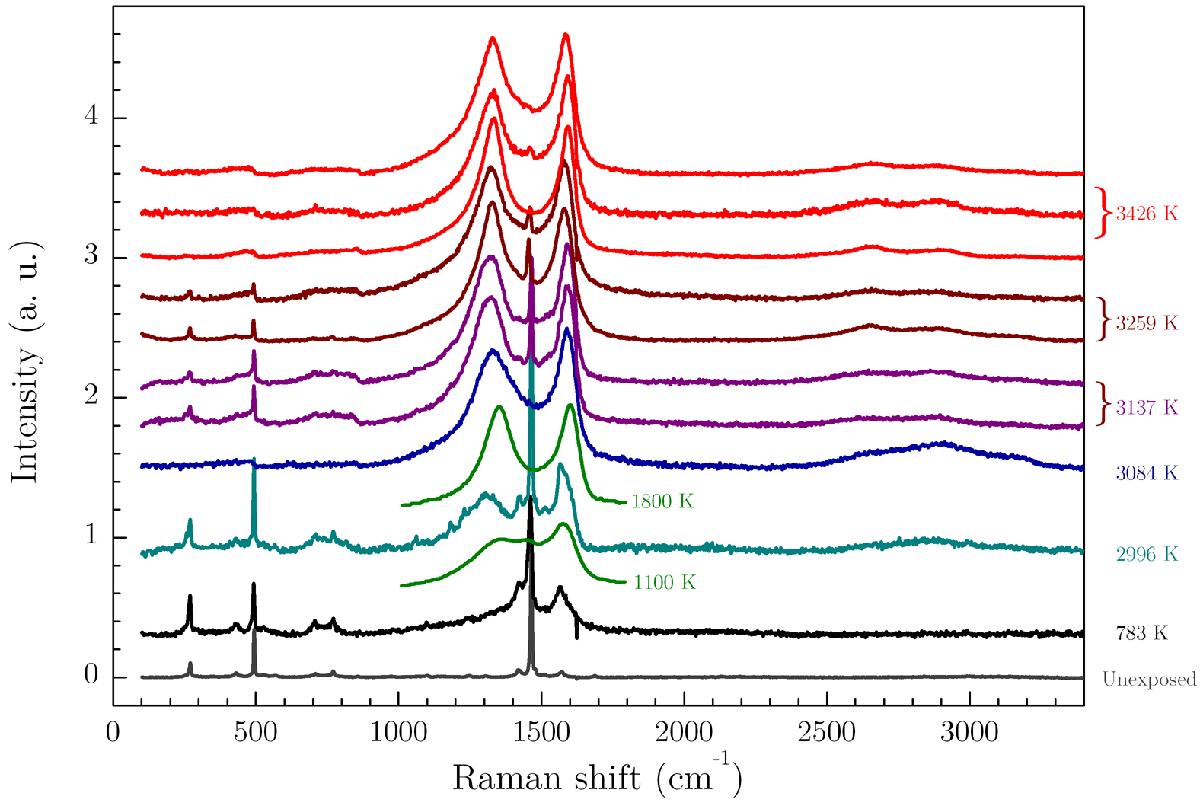
Raman spectra of micrometric particles collected after exposure of C60 to a millisecond shock wave in an Ar/H2 mixture versus reflected shock gas temperature Tg. The baseline was corrected. The sharp features are assigned to C60. For comparison, the Raman spectra of unexposed C60 (lower trace, this work) and of prolonged heat treated C60 in Ar flow at 1100 and 1800 K recorded by Mochida et al. (1997) are provided.
Current usage metrics show cumulative count of Article Views (full-text article views including HTML views, PDF and ePub downloads, according to the available data) and Abstracts Views on Vision4Press platform.
Data correspond to usage on the plateform after 2015. The current usage metrics is available 48-96 hours after online publication and is updated daily on week days.
Initial download of the metrics may take a while.