Fig. 6
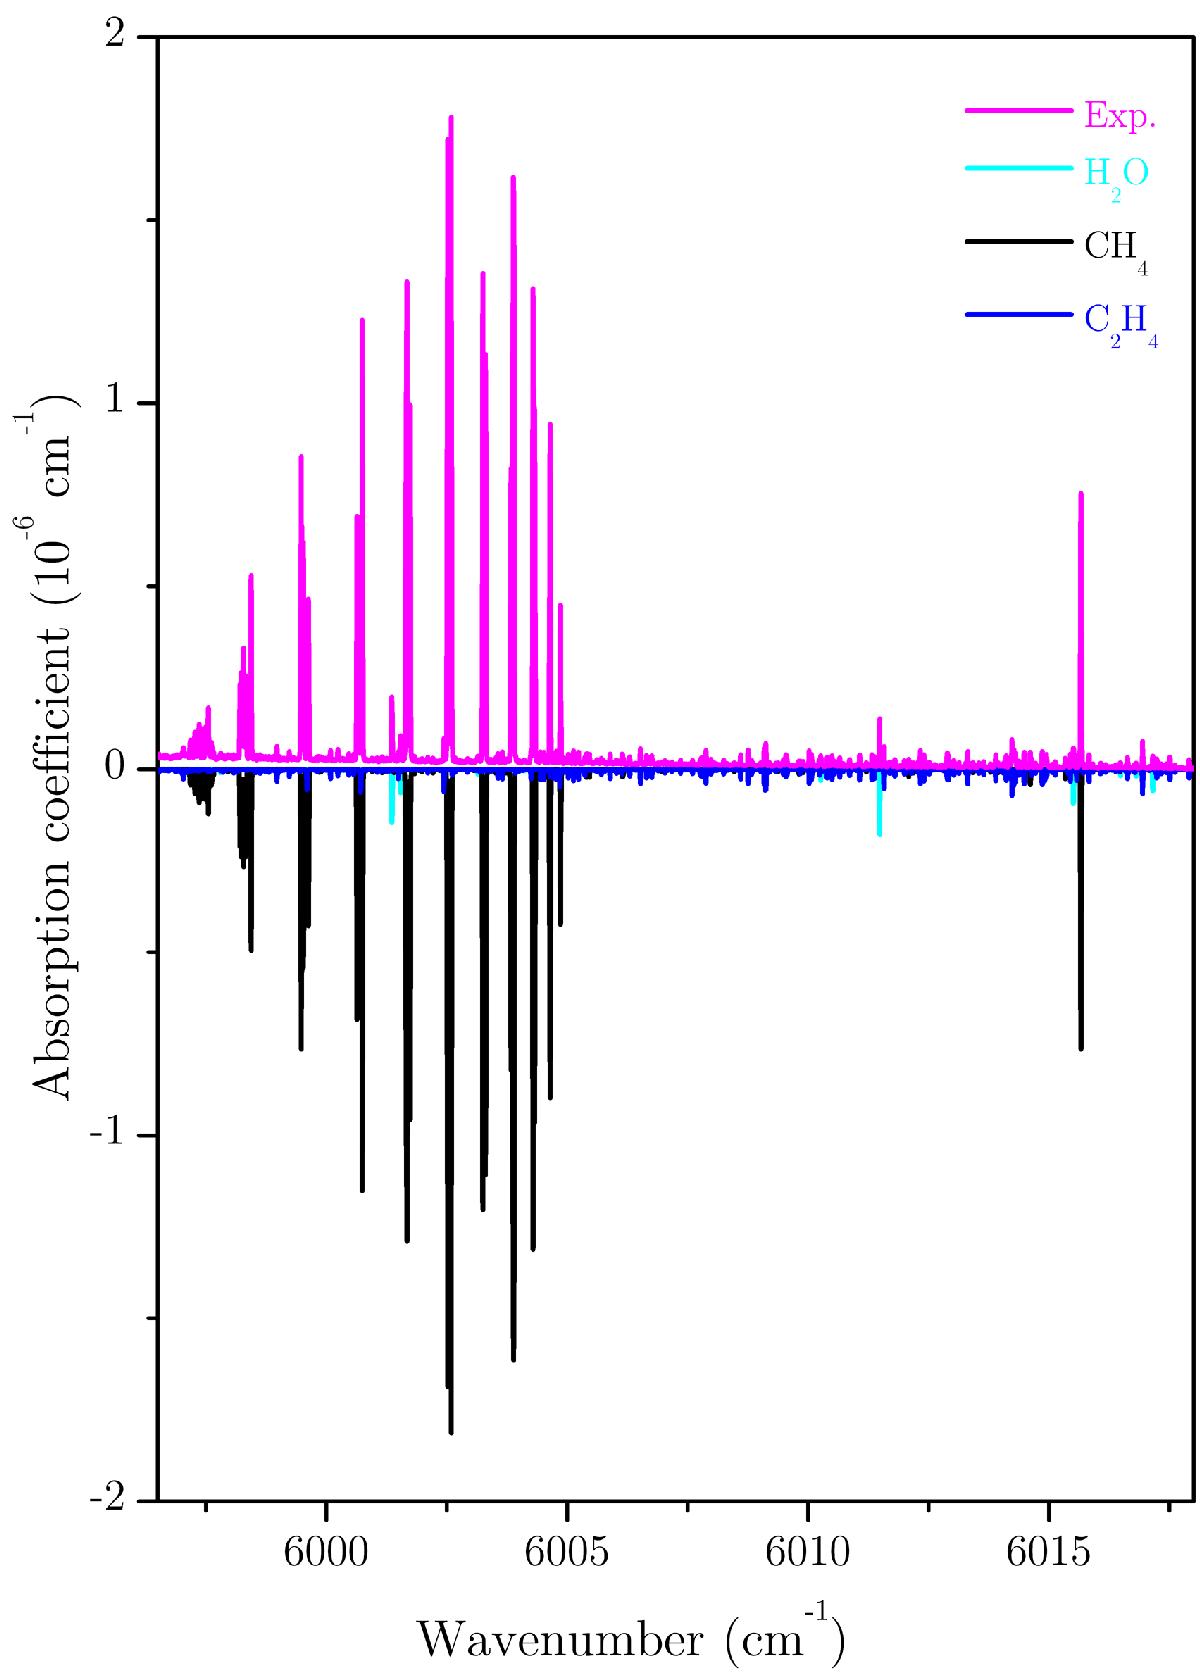
Top: experimental CRD spectrum of the sampled gas collected after exposure to a shock wave (initial mixture: C60 = 139 μmol, Ar = 0.229 mol, H2 = 0.054 mol) with a reflected shock gas temperature Tg of 2996 K. Bottom: simulated spectrum of methane CH4 and ethylene C2H4 from the WKMC (Campargue et al. 2012) and ethylene linelists (Lyulin et al. 2014). The presence of residual water vapor is accounted for with the help of the Hitran 2012 database (Rothman et al. 2013). During the shock, a ratio of H/H2 ~ 0.068 is achieved.
Current usage metrics show cumulative count of Article Views (full-text article views including HTML views, PDF and ePub downloads, according to the available data) and Abstracts Views on Vision4Press platform.
Data correspond to usage on the plateform after 2015. The current usage metrics is available 48-96 hours after online publication and is updated daily on week days.
Initial download of the metrics may take a while.