Fig. 8
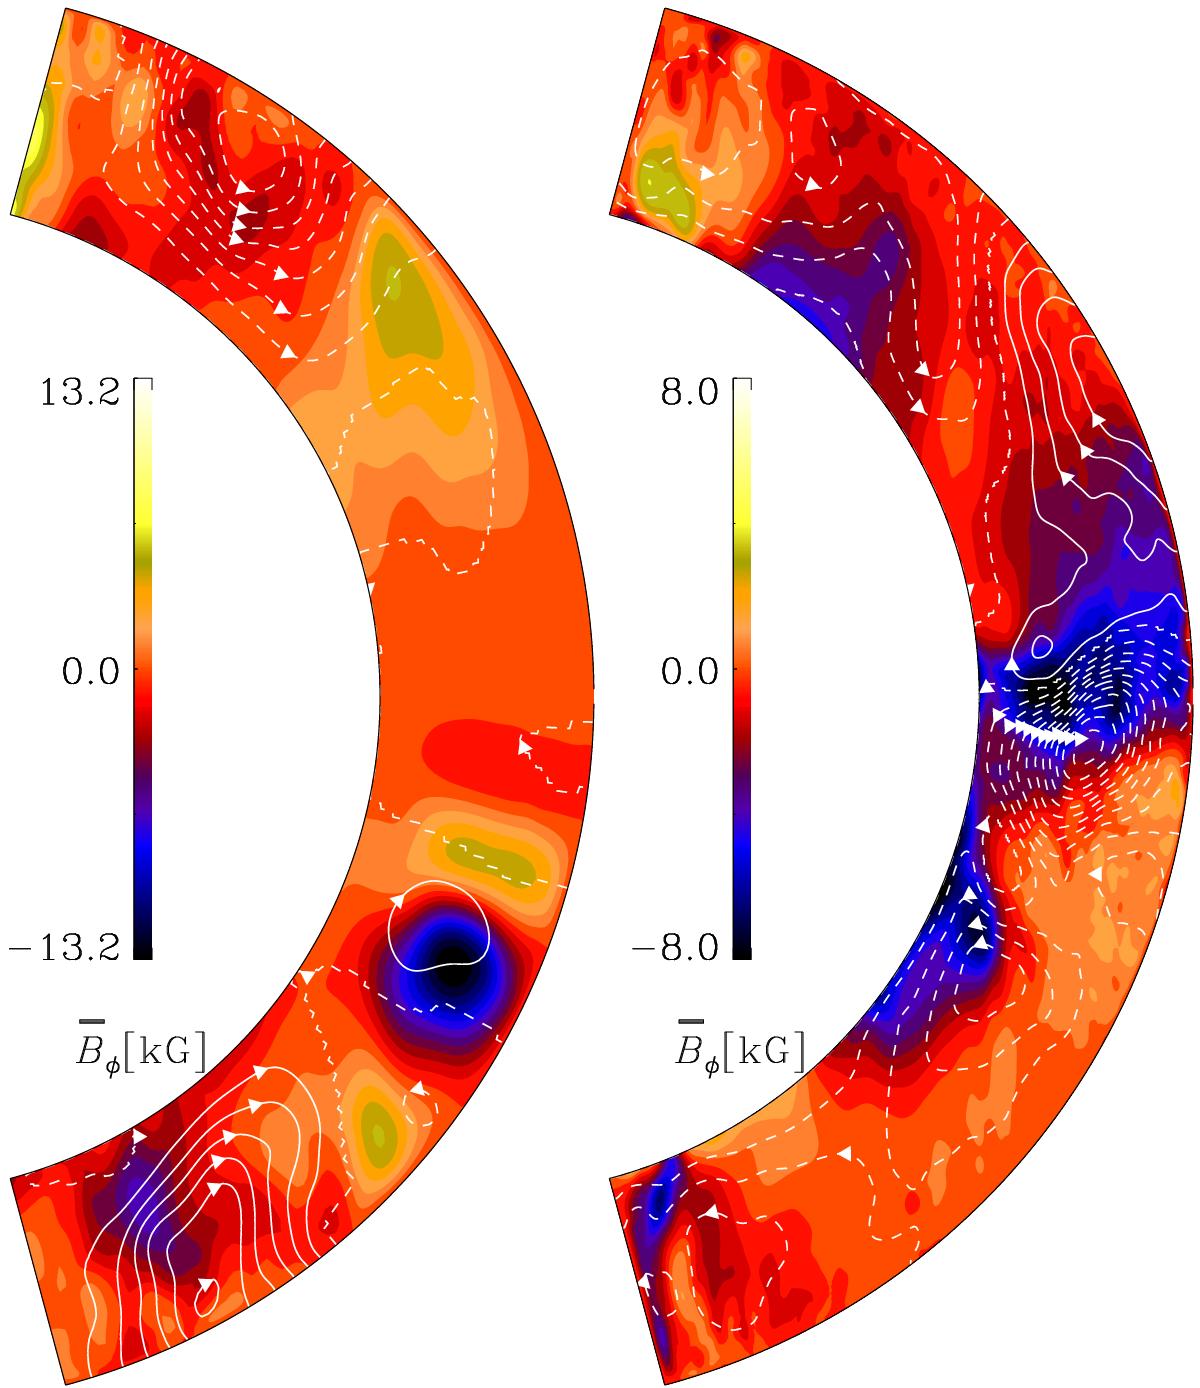
Azimuthally averaged azimuthal magnetic field ![]() (color contours) in units of kG and the fields lines of the poloidal field (continuous and broken lines for clockwise and anticlockwise loops, respectively). Left: data from Run B2 averaged over three months near a cycle maximum at t = 70 yr. Right: data from Run A5 averaged over the last ten years of the run.
(color contours) in units of kG and the fields lines of the poloidal field (continuous and broken lines for clockwise and anticlockwise loops, respectively). Left: data from Run B2 averaged over three months near a cycle maximum at t = 70 yr. Right: data from Run A5 averaged over the last ten years of the run.
Current usage metrics show cumulative count of Article Views (full-text article views including HTML views, PDF and ePub downloads, according to the available data) and Abstracts Views on Vision4Press platform.
Data correspond to usage on the plateform after 2015. The current usage metrics is available 48-96 hours after online publication and is updated daily on week days.
Initial download of the metrics may take a while.