Fig. 3
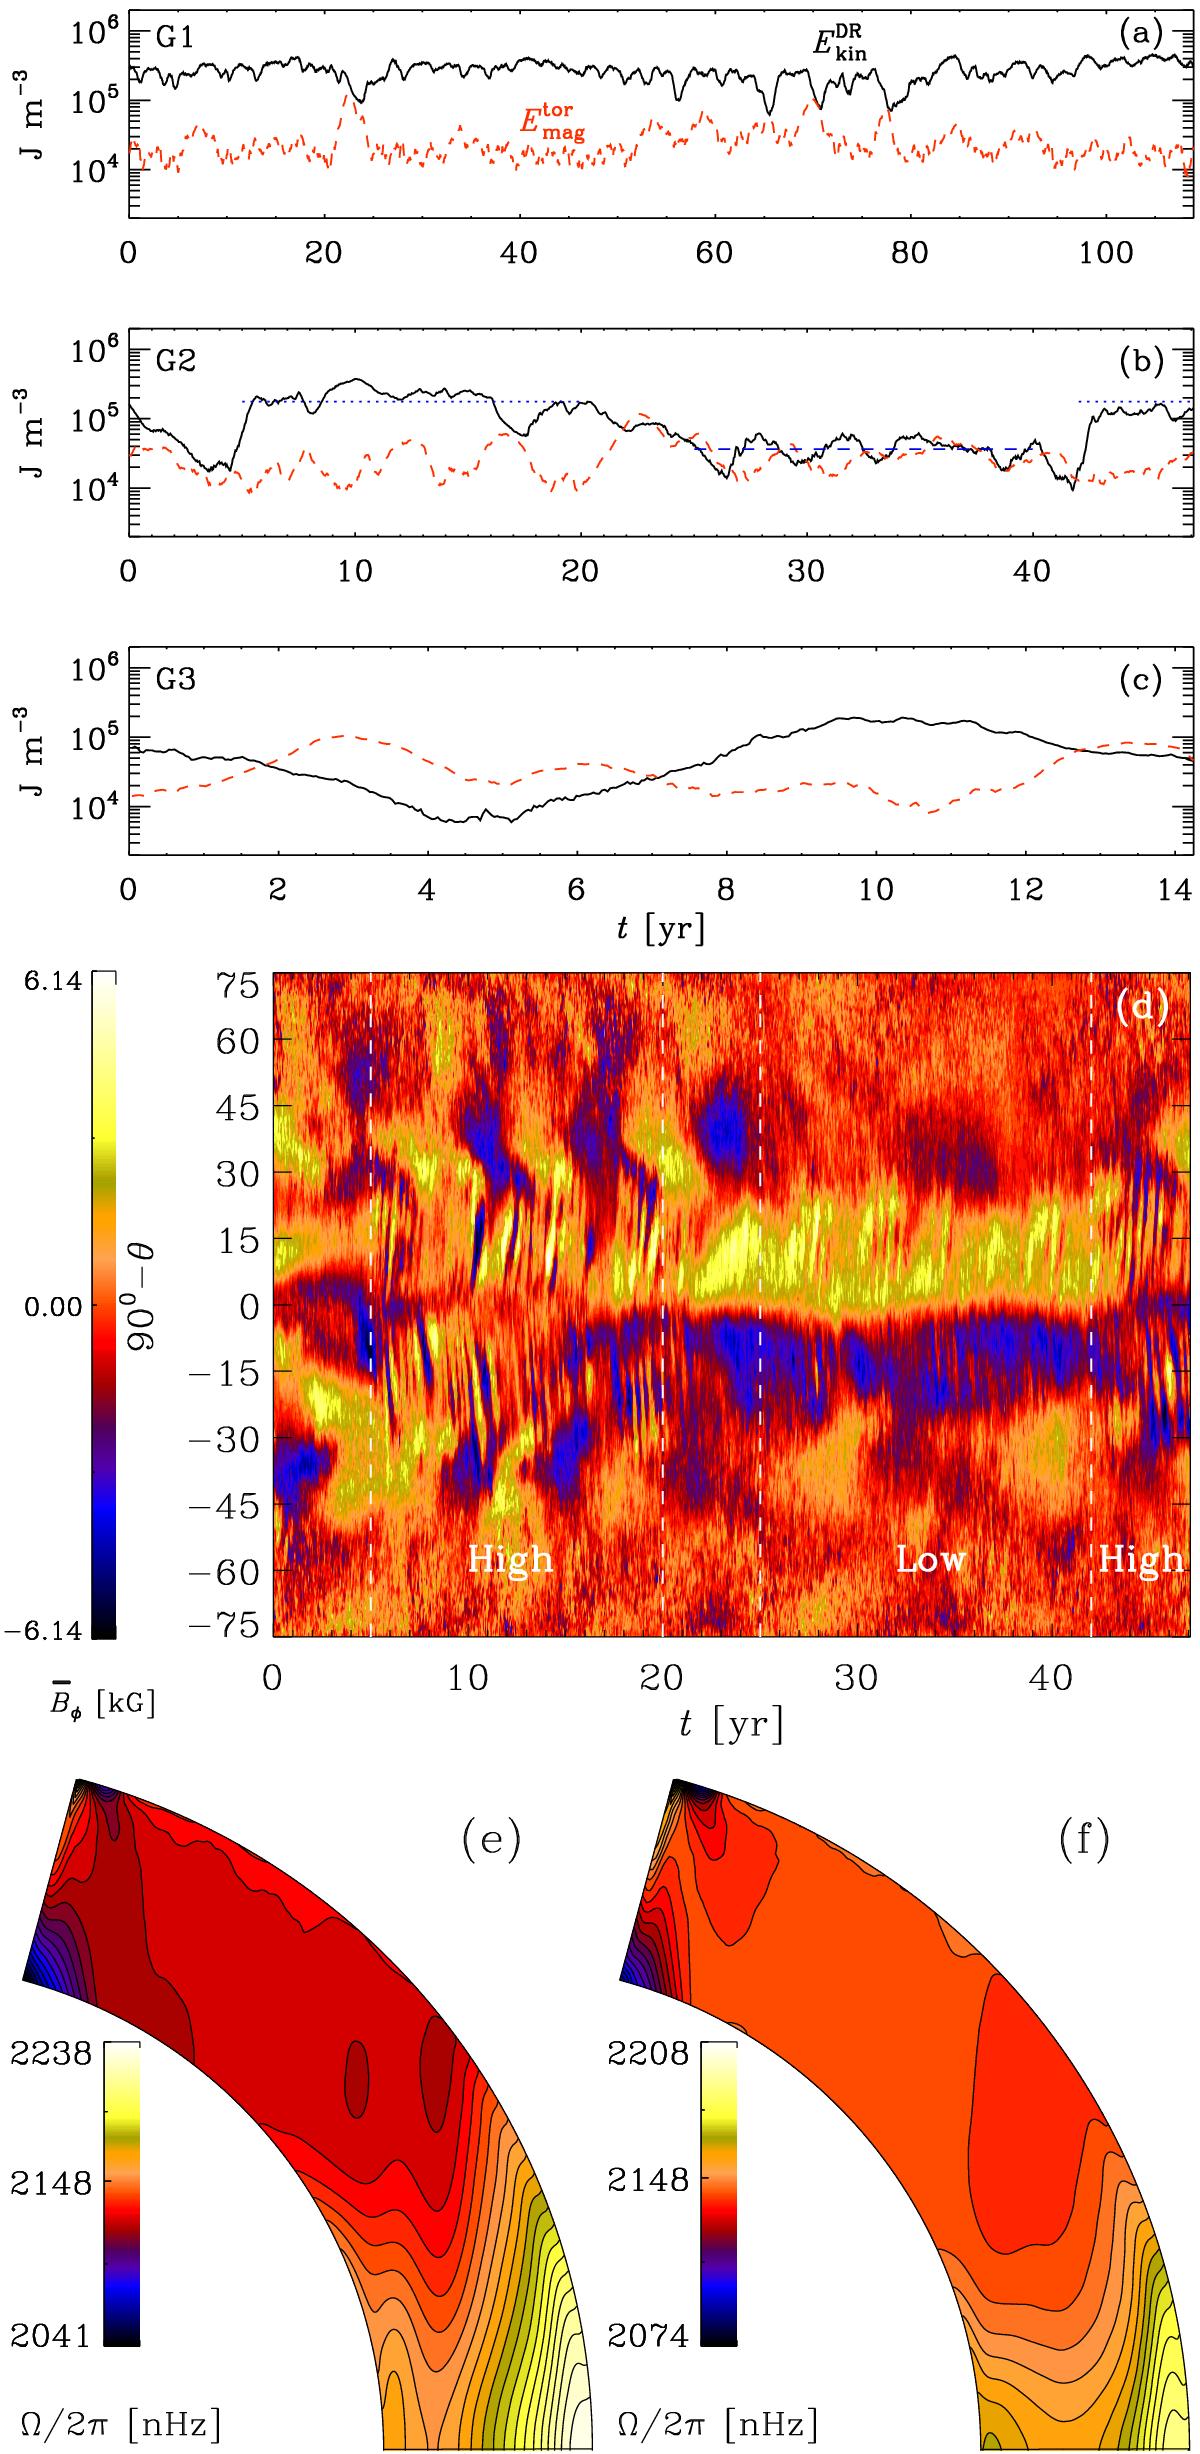
Energies of differential rotation (black solid lines) and mean toroidal magnetic field (red dashed) as functions of time from Runs G1, G2, and G3 (panels a)–c)). Panel d) shows the azimuthally averaged azimuthal magnetic field at r = 0.98 R⊙ from Run G2. The vertical dashed lines indicate the high and low states of differential rotation. Panels e) and f) show the time-averaged rotation profiles in Run G2 from the high and low states indicated as blue dotted and dashed lines in panel b).
Current usage metrics show cumulative count of Article Views (full-text article views including HTML views, PDF and ePub downloads, according to the available data) and Abstracts Views on Vision4Press platform.
Data correspond to usage on the plateform after 2015. The current usage metrics is available 48-96 hours after online publication and is updated daily on week days.
Initial download of the metrics may take a while.