Fig. 10
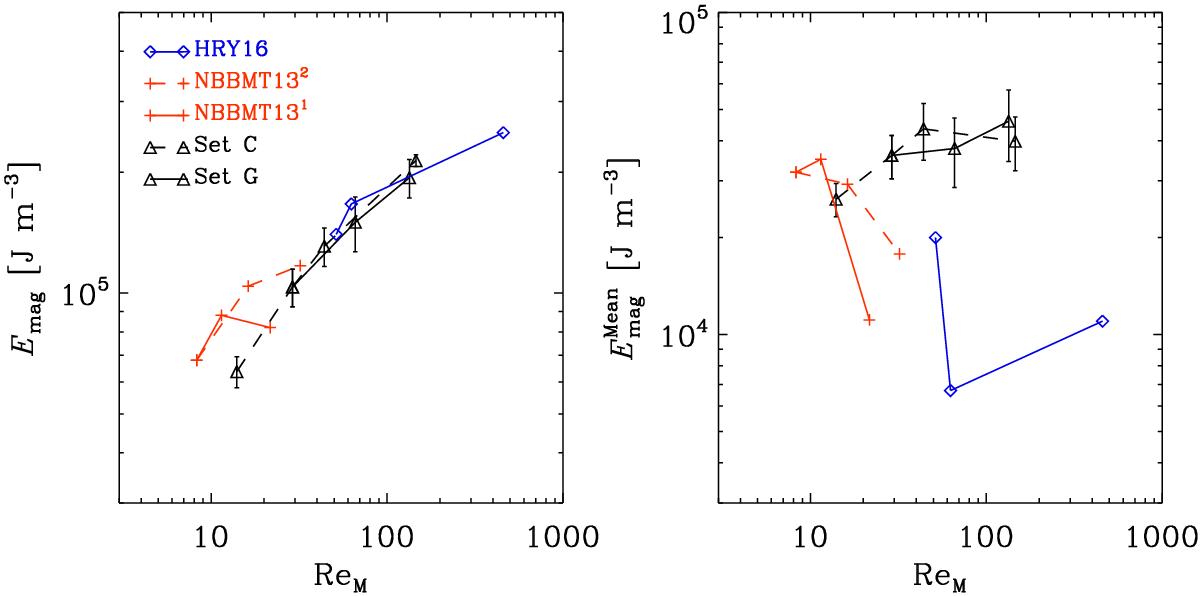
Energy densities of the total magnetic field (left panel), and the azimuthally averaged fields (right) from Sets C (black dashed line) and G (black solid), from two sets of runs by Nelson et al. (2013; solid and dashed red lines) and from Hotta et al. (2016; blue solid lines). The red solid line consists of data from cases D3, D3a, and D3b of Nelson et al. (2013) with PrM = const. = 0.5. Correspondingly, the dashed red line shows data from cases D3, D3-pm1, and D3-pm2 of Nelson et al. (2013) with PrM varying from 0.5 to 2. From Hotta et al. (2016) we show data for cases “Low”, “Medium”, and “High”.
Current usage metrics show cumulative count of Article Views (full-text article views including HTML views, PDF and ePub downloads, according to the available data) and Abstracts Views on Vision4Press platform.
Data correspond to usage on the plateform after 2015. The current usage metrics is available 48-96 hours after online publication and is updated daily on week days.
Initial download of the metrics may take a while.