Fig. 8
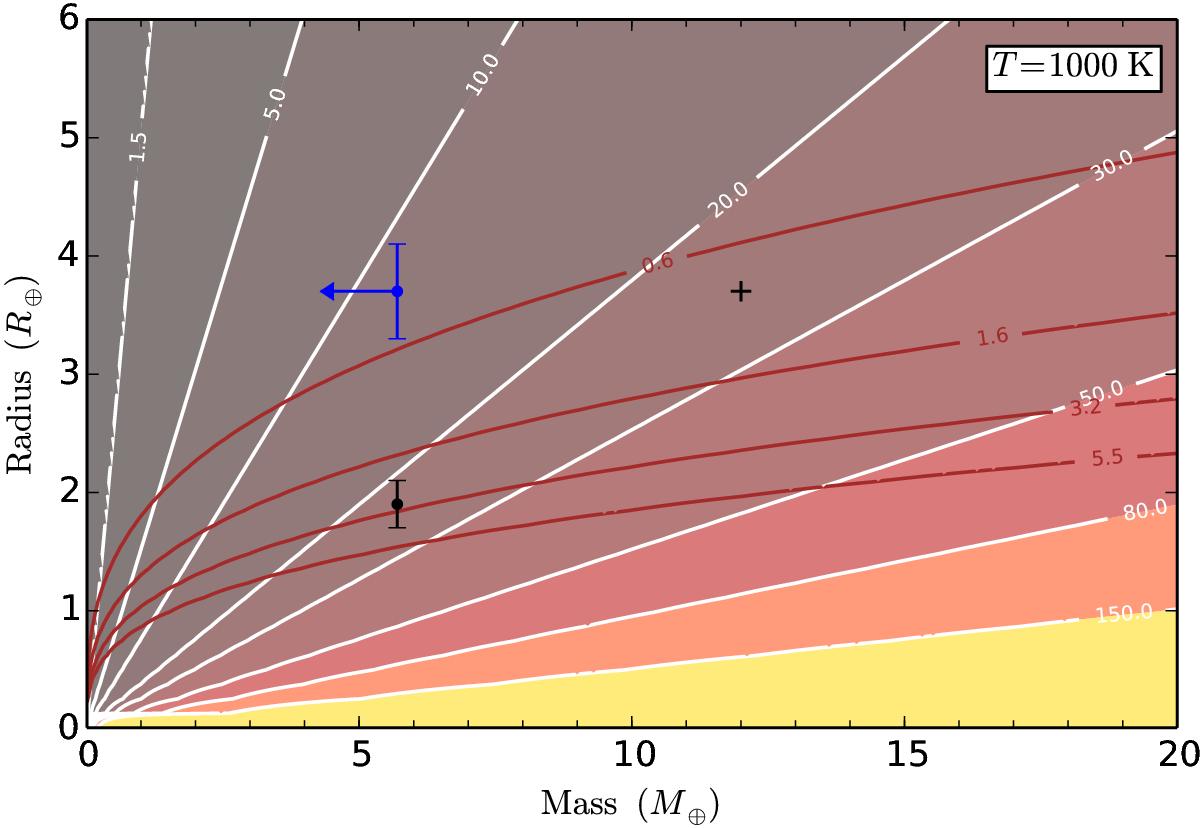
Colour-scaled value of Λ as a function of planetary mass and radius for Teq = 1000 K. The white straight lines indicate equal Λ values given in the plot. The red solid lines indicate lines of equal average densities of 0.6, 1.6, 3.2, and 5.5 g cm-3. The symbols correspond to the observed (blue bar and arrow) and possible mass-radius combination (black points) for CoRoT-24b.
Current usage metrics show cumulative count of Article Views (full-text article views including HTML views, PDF and ePub downloads, according to the available data) and Abstracts Views on Vision4Press platform.
Data correspond to usage on the plateform after 2015. The current usage metrics is available 48-96 hours after online publication and is updated daily on week days.
Initial download of the metrics may take a while.