Fig. 1
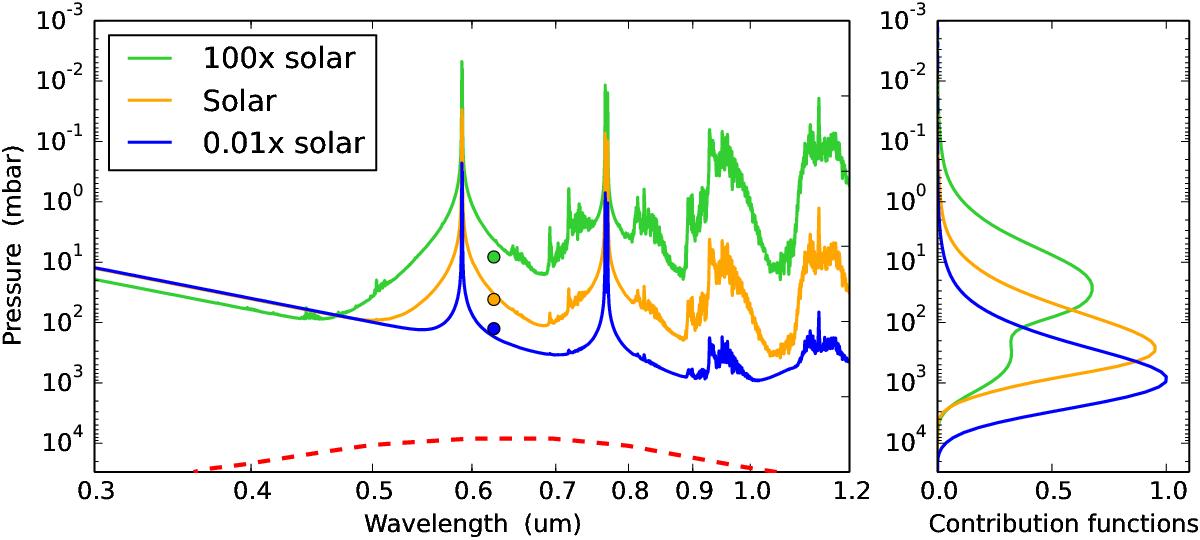
Left: synthetic transmission spectra calculated for a planet with Mpl = 5 M⊕, Rpl = 4 R⊕, and a 1000 K isothermal atmosphere with 0.01 (blue), 1.0 (orange), and 100 (green) times solar metallicity. The circles of corresponding colour denote the transmission curves integrated over the CoRoT spectral response curve (red dashed curve). Right: contribution functions for the vertical optical depth integrated over the CoRoT spectral response curve.
Current usage metrics show cumulative count of Article Views (full-text article views including HTML views, PDF and ePub downloads, according to the available data) and Abstracts Views on Vision4Press platform.
Data correspond to usage on the plateform after 2015. The current usage metrics is available 48-96 hours after online publication and is updated daily on week days.
Initial download of the metrics may take a while.