| Issue |
A&A
Volume 598, February 2017
|
|
|---|---|---|
| Article Number | A91 | |
| Number of page(s) | 19 | |
| Section | Planets and planetary systems | |
| DOI | https://doi.org/10.1051/0004-6361/201629670 | |
| Published online | 07 February 2017 | |
The young Datura asteroid family
Spins, shapes, and population estimate
1 Institute of Astronomy, Faculty of Mathematics and Physics, Charles University, V Holešovičkách 2, 18000 Prague, Czech Republic
e-mail: This email address is being protected from spambots. You need JavaScript enabled to view it.
; This email address is being protected from spambots. You need JavaScript enabled to view it.
2 Astronomical Institute, Czech Academy of Sciences, Fričova 298, 25165 Ondřejov, Czech Republic
3 Institute for Astronomy, University of Hawaii, 2680 Woodlawn Drive, Honolulu, HI 96822, USA
4 Observatoire de la Côte d’Azur, Boulevard de l’Observatoire, 06304 Nice Cedex 4, France
5 Astronomical Observatory Institute, Faculty of Physics, Adam Mickiewicz University, Słoneczna 36, 60-286 Poznań, Poland
6 IMCCE-CNRS-Observatoire de Paris, 77 avenue Denfert Rochereau, 75014 Paris, France
7 Lowell Observatory, 1400 W Mars Hill Road, Flagstaff, AZ 86001, USA
8 Southwest Research Institute, 1050 Walnut St, Suite 300, Boulder, CO 80302, USA
Received: 8 September 2016
Accepted: 4 October 2016
Abstract
Context. Asteroid families are the outcomes of disruption or cratering events on a size and energy scales that are not reproducible in laboratory experiments. Overall structure, as well as properties of individual members, in the old families could have been changed since their formation. Therefore young families preserve best the characteristics of the initial event.
Aims. We study the most suitable known asteroid family with an age of less than 1 Myr, the Datura family. We aim (i) to obtain information about rotation state and shape of the largest members in the family; and (ii) to constrain its debiased population down to couple of hundreds of meters in size.
Methods. We have analyzed the up-to-date catalog of orbital elements of main belt asteroids. We evaluated the detection efficiency of Catalina Sky Survey (CSS) in regard to detections of members in the Datura family, and we have used our photometric observations and lightcurve inversion methods to determine the rotation states and shapes of the largest members of the family.
Results. We determined rotation periods of the seven largest members of the Datura family, and we also derived accurate mean absolute magnitudes for six of them. Except for the largest fragment (1270) Datura, the asteroids tend to have long rotation periods and large amplitude of the lightcurve, witnessing an elongated shape. For the four largest asteroids, our observations allow us to resolve rotation pole and a rough shape. All of them are prograde-rotating and have the latitude of the rotation pole >50°. Our search in orbital catalogs resulted in the discovery of many small, sub-kilometer members of the Datura family. Using the CSS detection efficiency, we inverted this information into the debiased population of Datura family members. We show that the mass and angular momentum content in small fragments is negligible compared to the largest fragment (1270) Datura. These findings may help to constrain the formation mechanism of the family.
Key words: celestial mechanics / minor planets, asteroids: general
© ESO, 2017
1. Introduction
Research of asteroid families has occupied the agenda of planetary science for nearly a century (e.g., Hirayama 1918, 1922). However, as in many other topics in astronomy, efforts to understand and analyze asteroid families are very non-linear in time. After decades of low-interest hibernation, the families business started to flourish mainly due to great observational achievements since the 1980s−1990s: all-sky surveys discovered hundreds of thousands of new asteroids, broad-band photometric programs allowed gross mineralogical classifications for tens of thousands of asteroids, infrared space-born missions allowed to determine sizes and albedos for a comparable number of objects. This flood of new data caused a revolution likened to a transition from Zworykin’s tube TV set to today’s HD device.
One of the main interests in families consists of the fact that they are outcome of a giant fragmentation of a parent object. Not only do they allow us to probe its interior, by analyzing the individual fragments, but they also constrain physics and mechanics of the initial disruption process at energies unreachable in laboratory experiments. For this particular goal we would like to have available a snapshot of the family emerging right from the formation event. This is because as time passes, several dynamical processes influence the overall configuration of asteroids in the family, their surface properties and their rotation states (e.g., Nesvorný et al. 2015; Vokrouhlický et al. 2015). Our ability to determine, or at least constrain, ages of asteroid families, could be therefore highlighted as one of the important achievements of the past decade or so. As pointed out above, discovery and analysis of young families is of a special interest.
A first step along these lines was paved by discovery of the Karin family (Nesvorný et al. 2002). This ≃5.75 Myr old family was formed when a ≃5.8 km size impactor blasted a ≃33 km size parent body by hitting it at ≃5−6 km s-1 velocity producing about hundred fragments larger than ≃2.5 km (e.g., Nesvorný et al. 2006a). A couple of similar, but less well characterized families, of this category were discovered in the subsequent years (e.g., Nesvorný et al. 2015). However, even the Karin family was found to be affected by traces of dynamical evolutionary processes (e.g., Nesvorný & Bottke 2004; Carruba et al. 2016b). These findings motivated the hunt for even younger families.
The discovery of very young asteroid families, with ages less than 1 Myr, was made possible by applying a novel idea of searching clusters of asteroids in the space of osculating orbital elements rather than traditional proper orbital elements (e.g., Nesvorný et al. 2006b; Nesvorný & Vokrouhlický 2006). This actually accomplished an old idea dating back to at least Brouwer (1951) who noted that members in very young asteroid families should have orbits clustered not only in proper elements, but also their secular angles, longitude of node and perihelion. As of today, we know about eight such young families (see additionally, Pravec & Vokrouhlický 2009; Vokrouhlický & Nesvorný 2011). Some of them already posed interesting challenges for the asteroid break-up modeling, such as polarity of the largest members in the Schulhof family (e.g., Vokrouhlický & Nesvorný 2011; Vokrouhlický et al. 2016). However, the cluster around the largest asteroid (1270) Datura, thence the Datura family, is perhaps the most interesting of the currently known very young families. Not only it contains the largest number of members, but its location in the innermost part of the asteroid belt promises a good outlook for obtaining observational data with even small telescopes available to our group.
Mothé-Diniz & Nesvorný (2008) and Vernazza et al. (2009) used spectral observations and found that members of the Datura family could be classified either Sk, Sq or even Q types. The affinity to Sq and Q sub-class is interesting as it may fit the young exposed surfaces of the family members. A detailed spectral observation of (1270) Datura itself by Takato (2008) revealed no spectral variations over a rotation cycle. Moreover, analysis of depth of the ~0.95 μm absorption band, indicating degree of space weathering, revealed an evolved surface similar to that of old S-type asteroids. This either implies that space weathering is a fast process (Vernazza et al. 2009), or it could also imply that the largest remnant in the family reaccumulated most of dust contained in the regolith of the parent body (see Polishook et al. 2014, for comparison). In the previous paper from our group (Vokrouhlický et al. 2009), we reported numerous photometric observations of the largest member (1270) Datura that allowed us to resolve its rotation state and shape. We found it rotates in a prograde sense with short rotation period P = 3.3581 h and two possible pole orientations (λ,β) = (60°,76°) or (λ,β) = (264°,77°) (ecliptic longitude and latitude). Since our photometric measurements were carefully calibrated in the Johnson-Cousins system, we obtained Datura’s absolute magnitude in V band H = 12.65 ± 0.05, in a very good agreement with H = 12.61 ± 0.12 reported by Wisniewski et al. (1997). This accurate measurement of Datura’s absolute magnitude helped us to improve its size and albedo measurements, D ≃ 8.2 km and pV ≃ 0.29, obtained during the post-cryogenic phase of the WISE spacecraft (see, Masiero et al. 2012), who used an uncertain absolute magnitude value 12.5 from the Minor Planet Center (MPC) catalog. This problem has been thoroughly analyzed by Pravec et al. (2012), who developed a correction procedure. Using their technique we find Datura’s size of ≃8.17 km and its geometric albedo slightly lower, pV = 0.24. Since no WISE measurements are available for fainter Datura-family members, we use this albedo value for them as well.
In Vokrouhlický et al. (2009) we also reported observations of the second largest member in this family, (90265) 2003 CL5, for which we were able to determine a rough value of synodic rotation period of ≃23.42 h. Unfortunately, our data were too few to say more about rotation state of this asteroid. We also took advantage of improved orbital elements of Datura members and constrained its age to be between 450 and 600 kyr. More recently, Rosaev & Plavalova (2015) briefly analyzed updated orbital catalogs of asteroids and reported discovery of three new members in this family (compared to seven known previously, Vokrouhlický et al. 2009).
In this paper, we continue analyzing the Datura family by focusing on two aspects. First, in Sects. 2 to 4, we collect photometric observations of the largest members in this family (except for (1270) Datura that was analyzed in our previous study Vokrouhlický et al. 2009). For three cases, asteroids (90265) 2003 CL5, (60151) 1999 UZ6 and (89309) 2001 VN36, which are the second to fourth largest fragments in the family, we obtained enough data to resolve pole position and rough (convex) shape. In three other cases, our observations allowed us to determine synodic rotation period, giving us a fairly good knowledge of the rotational state of the largest members in the Datura family. Next, we conducted a search of new members in the family (Sect. 5). Our analyses, including orbital integrations in Sect. 5.1, reveal 17 members in the Datura family (plus 2 candidate objects, whose membership could be confirmed or rejected after their orbits become more accurate after their recovery). Finally, we combined this updated sample of Datura members with our-determined detection efficiency by Catalina Sky Survey and we derived constrains on the debiased size distribution of Datura-family asteroids (Sect. 6). Most importantly, we find that the total mass and angular momentum contained in all fragments smaller than (1270) Datura, the largest remnant in this family, are both negligible to that in (1270) Datura. In Sect. 7 we draw conclusions from our findings.
Aspect data for observations of (203370) 2001 WY35, (215619) 2003 SQ168, and 2002 RH292.
Aspect data for observations of (90265) 2003 CL5.
Aspect data for observations of (60151) 1999 UZ6.
Aspect data for observations of (89309) 2001 VN36.
2. Observations
We took photometric observations for five of the six largest secondaries with the 1.54-m Danish telescope (DK) on La Silla Observatory in Chile. The observations of (60151) 1999 UZ6 in 2009 were also obtained with the 1.05-m telescope on Pic du Midi (PdM) in France. The one night-run for 2002 RH291 was taken with the 4.3-m Discovery Channel Telescope (DCT) located forty miles southeast of Flagstaff at the Happy Jack site, Arizona. The individual runs and their observational circumstances are listed in Tables 1 to 4. The mid-time (UTC) of the run, rounded to the nearest tenths of day, is given in the first column. In the next five columns, its helio- and geocentric distances, solar phase angle and geocentric ecliptic longitude and latitude (equinox J2000) are given. The telescope used is specified in the last column, except for the 2008 observations of (90265) where the reference to Vokrouhlický et al. (2009) is given. A line with “L” is added in the cases where also sparse data from the Lowell photometric database were used for creating a convex shape model of the particular asteroid. Some of our results are summarized in Tables 5 and 6, while details are given in the text below. For five small members of the Datura family that were observed with DK154, we derived their mean absolute R magnitudes (HR). We converted them to the standard mean absolute V magnitude (H) using the measured or assumed V−R color index (Table 6). For derivation of the absolute magnitudes, we conservatively assumed the slope parameter G = 0.24 ± 0.11 that is the mean G for S and Q spectroscopic types (e.g., Warner et al. 2009).
The observations with the 1.54-m Danish telescope were obtained using the Bessell R filter, with supplementary observations in the V filter for (89309) 2001 VN36 on November 18, 2014, for (90265) 2003 CL5 on December 17, 2015, and for (215619) 2003 SQ168 on November 7, 2013. The goal was to derive the color index V−R for these objects, and thus to determine the absolute magnitude H in visible band. The observations were calibrated in the Johnson-Cousins photometric system using Landolt (1992) standard stars with the absolute accuracy 0.01−0.015 mag. Integration times were 180 s and the telescope was tracked at half-apparent rate of the asteroid, providing star and asteroid images of the same profile in one frame. For the long period of (89309) 2001 VN36, we did not need to take continuous observations but we took a short series of typically four images a few times per night, depending also on scheduling constraints of our other asteroid observations we ran on the nights; we worked (89309) 2001 VN36 as a secondary target on most of the nights. We processed and reduced the data with our aperture photometry reduction software Aphot32.
Five dense lightcurves of (60151) 1999 UZ6 from 2009 were obtained with the 1.05-m telescope equipped with L filter and THX 7863 CCD camera at Pic du Midi Observatory. Exposure times of 300 s in November and 400 s in December were used. After standard bias and flat-field correction with the ASTROL package (developped at IMCCE) the aperture photometry was carried out with the PHOTOM program included in the CCLR STARLINK package.
Images of 2002 RH291 taken at DCT were obtained using the Large Monolithic Imager (LMI), which is a 6144 × 6160 CCD (Levine et al. 2012). The total field of view is 12.5′ × 12.5′ with a plate scale of 0.12′′/pixel (unbinned). Images were obtained using the 3 × 3 binning mode. In order to maximize the signal-to-noise ratio of the object, we used a broad-band VR-filter, and an integration time of 200 s.
During our observing night, a series of bias and twilight flat fields were obtained to correct the images. We created a median bias and median flatfield. Target images were bias subtracted and flatfielded. Relative photometry using 25 reference stars was carried out using Daophot routines (Stetson 1987). More details about our data reduction and analysis are available in Thirouin et al. (2014, 2016).
Known rotation parameters from lightcurve observations of Datura family members.
Color indexes from our observations of Datura family members.
3. Rotation periods of Datura family members
We start discussing the case of three small asteroids for which our data were able to determine the synodic rotation period only. The observation circumstances for these objects are summarized in Table 1.
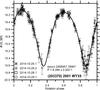 |
Fig. 1 Composite lightcurve of (203370) 2001 WY35 from 2014. The solid line is the fit fourth-order Fourier series representing the data. |
3.1. (203370) 2001 WY35
Four photometric runs of this asteroid were obtained from October 25 to 29, 2014. They revealed a large amplitude of the lightcurve of ≃1.6 mag and a synodic rotation period of 8.344 ± 0.003 h (Fig. 1). Therefore, the shape of the asteroid is rather elongated, though the large phase angle at the epoch of our observations (≃32°) may partly increase the lightcurve amplitude.
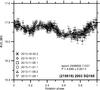 |
Fig. 2 Composite lightcurve of (215619) 2003 SQ168 from 2013. The solid line is the fit fifth-order Fourier series representing the data. |
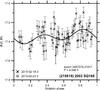 |
Fig. 3 Composite lightcurve of (215619) 2003 SQ168 from 2015. The solid line is the fit second-order Fourier series showing that there is a low-amplitude signal for the period obtained from the 2013 data. The exact ligthcurve shape is not well revealed due to noisy 2015 observations that were taken close to the aphelion of the asteroid’s orbit (see Table 1). |
3.2. (215619) 2003 SQ168
The photometric data obtained from October 30 to November 9, 2013 revealed a low amplitude lightcurve. We analyzed these measurements using the standard Fourier series method (e.g., Harris et al. 1989; Pravec et al. 1996, 2000), and obtained an estimate for the synodic rotation period of 4.646 ± 0.001 h. A period twice as long, with twice as many maxima and minima per rotation, is less likely but cannot be ruled out at this moment. Composite lightcurve with the data folded with the derived period is presented in Fig. 2. In February 2015 we observed the asteroid near the aphelion of its orbit, as opposed to the 2013 observations that were taken near the orbit perihelion. As a result, the target was rather faint and the data had large photometric errors. Still, they indicate a low-amplitude lightcurve again and confirm the period derived from the 2013 observations (see Fig. 3). Given the low amplitude observed in two apparitions, the asteroid has likely a roundish, nearly spheroidal shape. This is a unique feature among the six observed members of the Datura family.
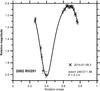 |
Fig. 4 Partial lightcurve of 2002 RH291 from July 8, 2015 observations. A high amplitude of 1.2 mag is revealed and a period about 5.3 h is suggested. |
3.3. 2002 RH291
We had a chance to observe this asteroid only during one night, on July 8, 2015, using the 4.3-m Discovery Channel Telescope operated by Lowell observatory near Flagstaff, Arizona. This provided only a limited dataset. Yet, the partial lightcurve was successfully reconstructed and it is shown in Fig. 4. It reveals a high amplitude of about 1.2 mag, indicating an elongated shape, like other four member of the Datura family (see Table 5 and text below). Assuming that the lightcurve is dominated by the second Fourier harmonic, which is a plausible assumption for its large amplitude (see, e.g., Harris et al. 2014), we estimate the rotation period to about 5.3 h with a relative uncertainty of 5−10%. More measurements are clearly needed to improve this value.
4. Rotation poles of Datura family members
Next, we discuss the case of three large members in the family for which the dataset was rich enough to allow a more detailed characterization of the rotation state. Namely, we determine sidereal rotation period and constrain pole orientation, as well as a rough convex shape.
4.1. Rotation pole and shape model for (90265) 2003 CL5
We used the available lighcurves listed in Table 2 to reconstruct the spin state and shape of asteroid (90265) 2003 CL5. To that goal we employed the inversion method of Kaasalainen et al. (2001). The data allowed to uniquely determine the sidereal rotation period P = (23.4153 ± 0.0002) h, however the pole direction was not well constrained. The formally best model has the pole direction (λ,β) = (11°,71°), but we found that all models with the ecliptic latitude of the pole β ≳ 50° provide a statistically acceptable fit to the data. The best-fit convex shape model is shown in Fig. 5. Although the model fits data well (see example lightcurves in Fig. 6), the real shape can be different from this convex approximation. In particular, we suspect the extreme elongation of our model may imply that (90265) 2003 CL5 could in fact be a recollapsed object consisting of two components in contact. We note that such a configuration could arise right at the formation event of the family as two escaping fragments get in touch, or later, when a formed binary undergoes instability and the satellite collapses on the primary. However, in order to resolve such details we would need observations at very high phase angles (that are in principle unavailable from the Earth for this main belt asteroid) or disk-resolved data to say more about the true and possibly non-convex shape of (90265) 2003 CL5 (e.g., Ďurech et al. 2015, and references therein for the corresponding methods).
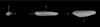 |
Fig. 5 The convex shape model of (90265) 2003 CL5, corresponding to the formally best-fit pole orientation, shown from equatorial level (left and center, 90° apart) and pole-on (right). |
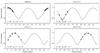 |
Fig. 6 Example lightcurves of (90265) 2003 CL5 (dots) shown with the synthetic lightcurves (solid curves) produced by the best-fit model in Fig. 5. The geometry is described by the aspect angle θ, the solar aspect angle θ0, and the solar phase angle α. |
One may wish to relate the pole orientation of (90265) 2003 CL5 to that of (1270) Datura more accurately, other than concluding the same sense of rotation and proximity of the formally best fit solution of (90265) 2003 CL5 and the pole P1 of (1270) Datura. For instance, we could question whether the current spin states may be used to say to which degree the initial spin orientation of the two asteroids was close to each other and try to draw conclusions from that. However, this is not possible also because of differential precession of the two poles and inherent uncertainty in their dynamics. In Vokrouhlický et al. (2009), we demonstrated that obliquity of (1270) Datura may take any value between ≃0° and ≃30° and the ecliptic longitude value cannot be deterministically inferred after ≃500 kyr of evolution since the origin of the family. In other words, pole orientation of (1270) Datura is entirely unpredictable within these bounds. This is because of two effects which both depend on dynamical ellipticity of the asteroid, a parameter that cannot be constrained better than to a ≃30% level: (i) precession due to solar gravitational torque in the orbital plane, and (ii) the obliquity oscillations due to a combined solar and orbital torques. Both effects have shorter periods than the estimated age of the Datura family (e.g., Vokrouhlický et al. 2006). The same is true for the spin dynamics of (60151) 1999 UZ6 and (89309) 2001 VN36 discussed in the next two sections. Thus even if the spin vectors of all these asteroids were initially perfectly collinear, they could be very different today and consistent with our-determined values.
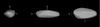 |
Fig. 7 The shape model of (60151) 1999 UZ6 corresponding to the pole direction (λ,β) = (18°,56°) shown from equatorial level (left and center, 90° apart) and pole-on (right). |
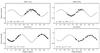 |
Fig. 8 Example lightcurves of (60151) 1999 UZ6 (dots) shown with the synthetic lightcurves (solid curves) produced by the best-fit model in Fig. 7. The geometry is described by the aspect angle θ, the solar aspect angle θ0, and the solar phase angle α and corresponds to the pole direction (λ,β) = (18°,56°). |
4.2. Rotation pole and shape model for (60151) 1999 UZ6
As in the case of (90265) 2003 CL5, we used all available lightcurve observations (listed in Table 3) and applied the inversion methods to derive its spin orientation and shape model. Because the dataset was rather limited in this case – only eight lightcurves from three apparitions – we found it useful to complement the dense photometry with 147 sparse photometry observations from the Lowell Observatory photometric database (e.g., Bowell et al. 2011). The sparse data cover the time interval from 1998 to 2011, suitably extending the dense dataset. Despite their limited photometric quality (typical uncertainty of ≃0.2 mag), they helped to constrain the rotation period and the spin axis direction of (60151) 1999 UZ6.
The global lightcurve inversion converged to two equally good solutions with the same rotation period P = (13.8836 ± 0.0001) h and pole directions (λ,β) = (18 ± 30°,56 ± 15°) or (179 ± 30°,86 ± 30°). The shape model corresponding to the first pole solution is shown in Fig. 7, while the observed and modeled lightcurves are compared in Fig. 8. The shape of (60151) 1999 UZ6 is rather elongated though not as extremely as in the case of (90265) 2003 CL5. We again find the rotation prograde. The same comment made for (90265) 2003 CL5 applies here: the initial near-collinearity of the spin axis of all largest members in the Datura family cannot be excluded nor proved from their current states.
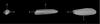 |
Fig. 9 The shape model of (89309) 2001 VN36 corresponding to the pole direction (λ,β) = (66°,63°) shown from equatorial level (left and center, 90° apart) and pole-on (right). |
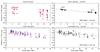 |
Fig. 10 Left: observed (blue) and modeled (red) data of (89309) 2001 VN36 shown as a function of the solar phase angle (abscissa, in degrees). Right: the residuals plotted with respect to the mean phase curve (dashed line). |
4.3. Rotation pole and shape model for (89309) 2001 VN36
We observed this asteroid in two apparitions: (i) during 20 nights from October 17 to November 11, 2014, and (ii) during 13 nights from February 8 to March 15, 2016 (see Table 4). While these data alone are not enough to determine rotation state and shape, they were initially very important to recognize the very long rotation period of this body. Their Fourier analysis revealed a single fundamental rotation period of about 73.2 h, with an uncertainty of about 0.2 h. For that reason we typically observed only two or three normal photometric points per night, which was sufficient to sample the lightcurve. In total, our observations consist of 81 calibrated photometric points in the R filter. By its character, this dataset resembles more sparse, rather than dense, photometry with very high accuracy: we estimate uncertainty of our normal points in the range of few hundreds magnitude only. Suitably, the 2014 observations cover large phase angles between ≃26° and ≃33°, while the 2016 observations were performed at complementary phases between ≃4° and ≃9°.
In order to constrain the pole orientation, we again combined our observations with those from the Lowell Observatory photometric database (127 individual measurements taken in between 2001 and 2012). These are sparse data of typically much lower accuracy (individual uncertainty of ≃0.2 mag). From this combined dataset, we obtained a unique solution for the sidereal rotation period P = 73.145 ± 0.002 hr and two solutions for the pole direction: (λ,β) = (66°,63°) and (270°,57°). Our estimated uncertainty is ≃40° in ecliptic latitude and ≃20° in ecliptic longitude. The shape model corresponding to the first pole solution is shown in Fig. 9. Similarly to the case of (90265) 2003 CL5, the convex model we present is only an approximation of the real, likely non-convex, shape of this asteroid. However, the available data do not allow us to reveal any non-convex details at this moment. Because the rotation period of (89309) 2001 VN36 is very long, and the sampling of its lightcurves sparse, we show the observed and modeled data as a function of the solar phase angle (Fig. 10). The residuals of the fit (right panels) are plotted with respect to the mean phase curve that was modeled as a combination of a linear and exponential function (see, e.g., Kaasalainen et al. 2002). We assumed that the phase curve was the same for both the V and R filters. We note that the shift between the two phase curves gives the formal V−R color index of −0.31 mag, which is inconsistent with the previously mentioned value V−R = 0.47 ± 0.01 mag that we measured. However, this inconsistency (caused most likely by incorrect calibration of Lowell Observatory data) does not affect our results because only the internal calibration of each data set is important for the modeling.
We find it very interesting that rotation of (89309) 2001 VN36, in spite of its long period, does not reveal any obvious signs of tumbling. This is because the available data can be fit with a model in which the body rotates about the shortest principal axis of the inertia tensor with a single sidereal rotation frequency. Consider, however, that the standard theory of the rotation wobble damping (e.g., Harris 1994; Sharma et al. 2005; Breiter et al. 2012; Pravec et al. 2014) would predict a characteristic de-excitation timescale of ≃6 Gyr (assuming μQ ≃ 1011, SI units, where μ is rigidity and Q quality factor). This is four orders of magnitude longer than the age of the Datura family. Either the degree of internal dissipation in (89309) 2001 VN36 is unusually large or, more likely, the body was formed by a gentle-enough process that did not excite the rotational wobble. A more exotic, third possibility would be assume that these elongated bodies are in fact re-collapsed binary systems by the binary YORP effect (e.g., Vokrouhlický et al. 2015). In this case, tides in the two components could possibly damp tumbling. The problem with this scenario though is the slow current rotation of these asteroids: re-collapsed binary would likely imply fast rotation and it is not clear what physical mechanism would slow it on a short timescale of the family age.
While the case of (89309) 2001 VN36 is extreme in this sense, we note that the canonical de-excitation timescale for (90265) 2003 CL5 would be ≃150 Myr and that of (60151) 1999 UZ6 would be ≃30 Myr, both again far longer than the Datura-family age. Since the rotation of all these asteroids do not show any obvious signs of tumbling, we suppose their initial rotation state must have also been quite close to the rotation about the principal axis of the inertia tensor. We think that these are important clues about the formation process of the family (see also Sect. 7).
5. Datura membership update
In order to obtain the current census of Datura-family members, we adopted the following multistep procedure. First, we searched candidates in the close vicinity of (1270) Datura orbit in the space of osculating orbital elements, obviously ignoring the mean longitude in orbit. This has left us with five orbital elements: semimajor axis a, eccentricity e, inclination I, longitude of node Ω and longitude of perihelion ϖ. We used asteroid orbits in the MPCORB catalog, provided by the Minor Planet Center, as of May 2016. Our criteria of orbital vicinity were simply a difference of osculating orbital elements with respect to (1270) Datura given by: | δa | ≤ 0.03 au, | δe | ≤ 0.03, | δI | ≤ 0.2°, | δΩ | ≤ 25° and | δϖ | ≤ 25°. Such conditions are rather liberal, since previously reported members in Nesvorný et al. (2006b), Nesvorný & Vokrouhlický (2006) or Vokrouhlický et al. (2009) have differences of all orbital elements nearly an order of magnitude smaller than the chosen limits. Our motivation here was that small members, presumably discovered in the past few years, might have been initially ejected from Datura by larger relative velocity and thus be located farther from the central asteroid.
With these criteria adopted, we found 50 asteroids in the vicinity of (1270) Datura. This obviously contains all six members discussed in Vokrouhlický et al. (2009) or nine members discussed in Rosaev & Plavalova (2015), but also 44 or 41 new candidates. In order to decide which of the additional asteroids in our sample are newly identified members of the Datura family, we adopted the following approach. We numerically integrated nominal orbits of all 50 candidate objects and (1270) Datura for 1.5 Myr backward in time. For sake of simplicity, we included only gravitational perturbations of planets in our simulations and used the well-tested swift software package1. The integration timestep was 3 days and we output orbital elements of all propagated asteroids every 5 years. We analyzed the behavior of secular angles Ω and ϖ, and determined whether they simultaneously converge to those of (1270) Datura for each of the 50 candidate asteroids. Our expected convergence epoch was about 500 kyr ago, the age of the family determined in Vokrouhlický et al. (2009), but because we used nominal orbits only we allowed ±250 kyr difference. As an independent information, we also downloaded a catalog of proper orbital elements from AstDyS website and computed distance δvprop of the candidate members from (1270) Datura using the standard metric. This was available for a sub-sample of our asteroids only, because proper elements are not available for uncertain orbits. We considered as potentially candidate members those bodies that had δvprop< 40 m s-1. This value is larger than the expected initial ejection velocity of kilometer-size Datura members, some 5−10 m s-1. However, Nesvorný & Vokrouhlický (2006) pointed out that the Datura family is very close to the M9/16 mean motion resonance with Mars. In fact, one of the previously known members – (89309) 2001 VN36 – was already shown to reside in this resonance. For this reason its formal distance from (1270) Datura in proper element space is δvprop ≃ 20 m s-1 (see also below).
Combining the two aforementioned methods, we found that 16 asteroids in our sample satisfy conditions for Datura-family membership. This nearly triples number of family members from Vokrouhlický et al. (2009) and doubles that from Rosaev & Plavalova (2015). All bodies are listed in the Table 7. In addition, we also found two single-opposition asteroids 2015 DY94 and 2015 PQ47 whose orbits are too uncertain to clearly decide about their membership. Their future recovery will reveal this information, but at this moment we exclude them from our further analysis. As expected, all new members are small, sub-kilometer asteroids discovered in the past five years or so. The smallest may have size of only ≃400 m.
Figure 11 shows Datura members for which the AstDyS site provided proper element values projected onto planes of proper semimajor axis vs proper sine of inclination and proper semimajor axis vs proper eccentricity. Obviously, asteroids residing on single-opposition orbits, or loosely constrained multi-opposition orbits, are not included in this plot. Six members are located very close to (1270) Datura at formal distance δvprop< 4 m s-1. This is expected for family members. Four other members have δvprop ≥ 12 m s-1, more than the estimated escape velocity from the parent body of the family. The reason for this peculiarity is also shown in Fig. 11, where we plotted the approximate location of the M9/16 mean motion resonance with Mars. Three Datura members, 89309, 433382, and 2009 VS116, are currently located in this resonance and their proper eccentricity and inclination slowly diffuse to larger values. We note that the typical uncertainty in proper semimajor axis values is very small. It only becomes significant when the asteroids are located in the M9/16 resonance. One member, 452713, even appears to jump over this resonance, accumulating a large perturbation in proper elements. This body has δvprop ≃ 40 m s-1 distance from (1270) Datura. The convergence of secular angles to (1270) Datura in our numerical simulation backward in time, however, give us a confidence that this asteroid is a true member of the family.
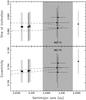 |
Fig. 11 Datura family members with proper orbital elements determined by the AstDyS database projected onto two-dimensional planes of proper semimajor axis vs. proper sine of inclination (top), and proper semimajor axis vs. proper eccentricity (bottom). Formal one sigma uncertainties are shown by error bars. The large diamond symbol shows the largest family member (1270) Datura. The dashed ellipse shows orbits at 6 m s-1 distance from (1270) Datura and ω + f = 30° and f = 40° at the moment of family formation (ω is argument of perihelion and f is the true anomaly). The gray interval of semimajor axis values approximately delimits the zone of the M9/16 mean motion resonance with Mars. Some Datura members, 433382, 89309 and 2009 VS116 from bottom to top, reside in this resonance. One asteroid, 452713, appears to jump over this resonance and resides on the extreme right of the plot. All these members have formally large distance δvprop> 12 m s-1 distance to (1270) Datura in the standard metric of the proper element space. |
An outstanding feature of the proper eccentricity and sine of inclination values of all Datura members is their large formal uncertainty (about 0.0015 for eprop and 0.001 for sinIprop). This is larger than for typical stable orbits in the asteroid main belt. We found this effect is caused by proximity of the z2 secular resonance to the Datura family. Indeed, for (1270) Datura itself one has 2(g−g6) + s−s6 ≃ 0.6 arcsec yr-1, where (s,g) are proper node and perihelion frequencies and (s6,g6) are the secular planetary values (characterizing Saturn’s nodal and perihelion orbital precession frequencies). A similar value holds for other Datura-family members. We verified by direct numerical integration of Datura’s orbit that the resonant angle 2(ϖ−ϖ6) + Ω−Ω6 slowly circulates with a period of about 2.1 Myr. This indicates proximity of the secular resonance. Consequently, the orbital eccentricity and inclination show long-term oscillations with this period and this effect makes determination of their proper values uncertain. The z2 resonance is rather weak, such that its width is only ≃0.2−0.3 arcsec yr-1 in the Datura zone (e.g., Milani & Knežević 1994; Carruba et al. 2016a).
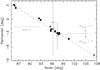 |
Fig. 12 Correlation between osculating longitude of node Ω (abscissa) and longitude of perihelion ϖ (ordinate) for Datura members. Large diamond is (1270) Datura, black symbols are for multi-opposition members and gray symbols are for single-opposition members. Formal one sigma uncertainty of Ω and ϖ are shown by error-bars, often smaller than the symbols. The open symbols are for asteroids 2015 DY94 (left) and 2015 PQ47 (right) whose orbits are very uncertain at this moment. The dashed line has a slope ≃−0.5. Asteroids with negative difference ΔΩ with respect to (1270) Datura have larger value of the proper semimajor axis and vice versa. Those with ΔΩ approximately in between −12° and −5° are captured in the M9/16 mean motion resonance with Mars. |
In order to confirm the membership of small asteroids in the Datura family, especially for those residing on badly constrained orbits for which we do not have proper elements computed, we performed the following test. In Fig. 12 we plot the current osculating values of the secular angles Ω and ϖ. It has been observed already by Rosaev & Plavalova (2015) that their values are correlated. Indeed, data for all 17 Datura members from Table 7 indicate a nearly linear correlation between Ω and ϖ with a negative slope of ≃−0.5. This result can be understood using the following argument. The relative difference in longitude of node ΔΩ with respect to (1270) Datura can be approximated for any other member of the family by  (1)a similar relation holds also for longitude of perihelion Δϖ with the s frequency interchanged by the g frequency. The three terms in the right hand side of Eq. (1) have the following meaning: (i) ΔΩ0 is the initial nodal difference at the epoch of family formation due to ejection velocity field; (ii) the second term expresses differential node precession due to the proper-frequency s dependence on the semimajor axis a, Δaprop,0 is the initial difference in proper a values of the asteroid and (1270) Datura and T is the age of the family; and (iii) the third term is similar to the second term, but accounts for a linear change ȧprop in proper semimajor axis due to the Yarkovsky effect. Formulation in Eq. (1) neglects short-term variations in semimajor axis and other than proper frequency in precession of node and pericenter. While inexact, this approximation is acceptable for our general argument.
Equinoctial orbital elements, and their uncertainty, of the Datura family members as of epoch MJD 57 400.0.
All terms in Eq. (1) contribute to the observed nodal and perihelion differences at the current epoch. However, we find the second term presently dominates, which helps to explain the linear correlation between the Ω and ϖ values in Fig. 12. First, we find that the effect of initial nodal dispersion should be very small. Using Eqs. (5) and (6) in Nesvorný & Vokrouhlický (2006) we have, for instance, ΔΩ0 ≃ V/ (VorbsinIprop), where V ≃ 6 m s-1 is the characteristic ejection velocity of the family members Vorb ≃ 20 km s-1, and sinIprop ≃ 0.09 is the proper sine of inclination. Using these numerical values we obtain ΔΩ0 ≃ 0.2°, much less then observed. In order to estimate maximum contribution of the second term, we use (∂s/∂a) ≃ −38 arcsec yr-1 au-1 appropriate for Datura family location, Δaprop,0 ≃ 0.001 au (see Fig. 11) and T ≃ 0.5 Myr (e.g., Vokrouhlický et al. 2009). These values imply the second term in Eq. (1) could be approximately up to ≃7° large. This is the right order of magnitude observed in Fig. 12. As to the last term, we note that sub-kilometer size observed Datura members may have ȧprop ≃ 5 × 10⁻⁴ au Myr-1 (e.g., Bottke et al. 2006; Vokrouhlický et al. 2015) or smaller, which implies the third term in Eq. (1) may be approximately ≃0.7°, about an order of magnitude smaller than the second term, but already larger than the first term. Because nodal longitude drifts in a retrograde sense, while perihelion longitude in a prograde sense, and because the value of the drift is larger for larger semimajor axis, one readily obtains the linear relationship between Ω and ϖ with a negative slope and Datura members with Δaprop,0> 0 having smaller Ω values (see Fig. 12). In the approximation of zero eccentricities and inclinations (linear theory of secular dynamics), one would have s and g frequencies exactly equal and the slope in Fig. 12 would be −1. The observed value ≃−0.5 is different. We believe this is due to a combination of two effects: (i) eccentricity and inclination of Datura-family orbits are non-zero, such that non-linear corrections change their values; and (ii) s and g frequencies depend not only on the semimajor axis; but also the eccentricity and inclination values. The latter effect is perhaps more important. Figure 11 shows that Datura members indeed have slightly different eprop and sinIprop values in correlation with their aprop. This should change the Ω vs. ϖ correlation slope enough, to explain the observed value.
Finally, we wanted to make sure that no further, more distant members of the Datura family were overlooked in our analysis. We thus repeated our initial search of Datura-family candidates in a larger box around (1270) Datura in the space of osculating orbital elements. In this case we used: | δa | ≤ 0.04 au, | δe | ≤ 0.04, | δI | ≤ 0.3°, | δΩ | ≤ 35° and | δϖ | ≤ 35°. With these parameters we obtained 148 potential family candidates. This sample contained 50 candidates from the smaller box analyzed above, and 98 new, more distant asteroids. We numerically integrated their nominal orbits backward in time and analyzed, whether they converge to (1270) Datura or not. When available, we also downloaded their proper orbital elements from AstDyS site and computed distance from (1270) Datura using standard metric. Both tests showed that none of the new 98 asteroids is a member of Datura family. Therefore we conclude that the list provided by Table 7 is complete as of May 2016.
5.1. Past convergence of Datura members
While it is not our intention to revise the approximate age of the Datura family from Vokrouhlický et al. (2009) in this paper, we substantiate our analysis from the previous Section by proving the convergence of the Datura members, including some of the newly discovered here, to (1270) Datura. In particular, we used all multi-opposition asteroids listed in Table 7. We thus excluded only the single-opposition asteroids from our analysis, because their orbits are presently too uncertain and not suitable for our work. We used the general methodology and tools described in Nesvorný & Vokrouhlický (2006).
Each asteroid is represented by a certain number of clone variants which differ by (i) the initial orbital conditions at the MJD epoch 57 400.0; and (ii) the strength of the Yarkovsky effect. As to the first class (i), we used orbital elements listed in Table 7 and made the clones sample the six-dimensional hyper-ellipsoid of the initial data uncertainty using the full covariance matrix of the orbital fit. The latter was obtained for each of the asteroids from the AstDyS site. We used 31 clones for (1270) Datura, and 51 clones for other asteroids. As to the second class (ii), we estimated minimum and maximum strength of the Yarkovsky effect using the analytic formulation in Vokrouhlický (1999). For the largest four asteroids, (1270) Datura, (90265) 2003 CL5, (60151) 1999 UZ6 and (89309) 2001 VN36, we could set minimum Yarkovsky drift of the semimajor axis (da/ dt)min = 0. This is because we proved that their rotation is prograde and thus the obliquity smaller than 90°. In the case of smaller objects, we must account for both negative and positive drift-rates in some maximum limits (da/ dt)max. This value is ≃2 × 10⁻⁴ au Myr-1 for a kilometer-size asteroid in the Datura heliocentric distance (e.g., Bottke et al. 2006). For objects of a different sizes D, we use the standard scaling (da/ dt)max ∝ 1 /D. The sizes were estimated from the absolute magnitudes and an albedo pV ≃ 0.24 of (1270) Datura (Sect. 1). We used 16 Yarkovsky clones for (1270) Datura, and 51 clones for other asteroids. The overall fewer number of clone variants for (1270) Datura is justified by its most accurate orbits and, especially, smallest strength of the Yarkovsky effect.
We used the software package swift for integration of Solar system bodies with our own modifications to account for the non-conservative Yarkovsky effect (see, e.g., Nesvorný & Vokrouhlický 2006). Planetary orbits, Mercury through Neptune, at the initial epoch of our simulation were taken from the JPL ephemerides DE405. The integration timestep was 5 days, and we carried the simulation to 1 Myr to the past. We output the state vectors of all integrated bodies, planets and asteroids, every 3 yr for further analysis. At this stage, we read the state vectors of all bodies at each of the output epochs and consider 106 combinations (identifications) between the clone variants of each asteroid and those of (1270) Datura. For simplicity, we relate here the family members to the largest remnant only and do not run identifications of the clone variants of the smaller members between each other. For the chosen pairs of clones in the million trials, we evaluate a distance using two metrics.
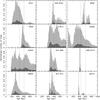 |
Fig. 13 Convergence of secular angles Ω and ϖ of Datura members to the largest fragment (1270) Datura. The histograms show number of converging trials in the past regrouped into 10 kyr bins: (i) light gray for a cut-off limit δV< 5 m s-1; (ii) the dark gray for a cut-off limit δV< 2 m s-1. Each time the histograms were normalized to unity for the first case. Left and middle columns for asteroids on stable orbits away from the M9/16 mean motion resonance. The right column for objects that either currently reside in this resonance (89309, 433382 and 2009 VS116), or the extreme member that jumped over this resonance (452713). |
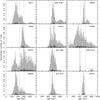 |
Fig. 14 Same as in Fig. 13, but now using the second of our convergence criteria. In this case we monitored distance of the (1270) Datura clones from those of family members in Cartesian space and in the same time evaluated their relative velocity. When both quantities became smaller than chosen threshold values, ideally the estimated radius of the Hill sphere of Datura-family parent body and its escape velocity, we considered the configuration converging. The light gray histograms show normalized appearance of converging cases in 10 kyr bins for distance limit of 5000 km and the velocity limit of 10 m s-1. The dark gray cases have instead 2500 km and 5 m s-1 limits. |
First, we consider the secular angles only: longitude of node Ω and longitude of perihelion ϖ. As discussed in Sect. 5, the initial spread ΔΩ0 and Δϖ0 should be much smaller than today (see Eq. (1) and Fig. 12), on the level of ≃0.1°−0.2°. We can thus use convergence of differences of the secular angles of a particular family member and those of (1270) Datura δΩ and δϖ to the ΔΩ0 and Δϖ0 level as a tracer for possible epoch at which the family was formed. However, instead of using the two elements separately, we follow tradition and combine them to a target function 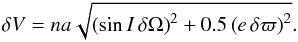 (2)Here, na is roughly the mean orbital velocity of asteroids in the Datura zone, ≃20 km s-1, I and e are inclination and eccentricity values. The relative weight coefficients of the two terms on the right hand side of Eq. (2) arises from randomization of the mean longitude in orbit at which we consider encounter of the two asteroids. The multiplication factor na in Eq. (2) makes the target function δV a velocity and offers naturally a possibility to set a criterion of convergence. This is because we know the initial ejection velocities of fragments should be of the order of escape velocity Vesc from the parent body of the family. Using Vesc ≃ 0.6 Dpar in meters per second from Pravec et al. (2010; supplementary materials), and estimating Dpar ≃ 8.3 km (consider (1270) Datura’s estimated size from Sect. 1 and results in Sect. 6), we obtain Vesc ≃ 5 m s-1.
Our second method, is more ambitious, and seeks convergence of the two bodies – clone variants of any of the chosen Datura-family members and those of (1270) Datura – in Cartesian space. This represents conditions right after family formation more accurately than just the secular-angles monitoring in our first method. In quantitative terms, we would like to bring the asteroids into nearly a single point in space, but orbital chaoticity, possible incompleteness of our dynamical model and finite number of clone variants we use prevent such a precise result. Instead, we are content with somewhat weaker condition, notably bringing the asteroids into a distance comparable with the Hill sphere RHill of the parent body. Using again RHill ≃ 90 aDpar in kilometers from Pravec et al. (2010), we estimate RHill ≃ 1700 km.
Figure 13 shows results of our first method based on convergence of secular angles. Each of the panels corresponds to one of multi-opposition asteroids listed in Table 7. The right column is for Datura members residing in (or beyond) the M9/16 mean motion resonance. Chaotic dynamics associated with location in the resonance, and in particular transition through the separatrix of the resonance, could make our effort of convergence of the orbits difficult to achieve with the limited number of clones. Indeed, this is observed especially for the last two asteroids, 2009 VS116 and (452713) 2005 YP136 (which is located even beyond the M9/16 resonance). The dashed vertical lines indicate the uncertainty interval of Datura age inferred from integrations in Vokrouhlický et al. (2009). Indeed, this interval is at intersection of possible convergence solution of the most accurate and reliable orbits in the left and middle columns. Most importantly, we verified that all multi-opposition asteroids, including the newly discovered in this paper, do have convergence solutions compatible with the age of the family.
Figure 14 shows results of our second method based on convergence in Cartesian space. Admitting slight inaccuracy of the dynamical model, chaoticity of the orbital evolution, limited number of clone variants and 3 yr sampling of the convergence conditions we contended ourselves with somewhat softer criteria. Therefore, the light gray histograms assume relative distance and velocity limits of 5000 km and 10 m s-1, while the dark gray histograms are for 2500 km and 5 m s-1. In general, the solution corresponds very well to that in Fig. 13, indicating again a possibility to find convergent solutions to (1270) Datura even with this straightened criterion. This gives us high confidence that the suggested asteroids are real members of the Datura family.
6. Constraints on Datura-family population
We now take the advantage of a significant increase in Datura population from Sect. 5, and we try to constrain the true, debiased population of this family. In order to do that, we need a connection between the true and the observed Datura populations. This is provided by the detection efficiency Be, such that the number dn(H) of observed (known) Datura members in the magnitude range (H,H + dH) is related to their true number dN(H) via: dn(H) = Be dN(H). Unsurprisingly, Be is primarily a function of asteroid absolute magnitude H, such that Be ≃ 1 for bright asteroids and becomes zero for faint objects. Obviously, Be also depends on heliocentric orbital elements, which in our case we shall adjust to those of Datura family members. A few details about our determination of Be is given in Sect. 6.1.
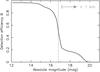 |
Fig. 15 Detection efficiency function Be characterizing performance of the two stations at Catalina Sky Survey: the 1.5-m Mt. Lemmon telescope (code G96) and 0.8-m Catalina telescope (code 703). The smaller of the two covers larger area of the sky, allowing a nearly complete census of brighter members in the Datura family. The detection efficiency drops below 0.5 at ≃16.8 mag, mainly due to performance of station 703. The non-negligible detection-efficiency tail to fainter objects of a magnitude up to 20 is due to observations of the larger, Mt. Lemmon telescope. Because the station G96 searches a smaller sky area near ecliptic, it could miss some orbits and the efficiency stays below 0.2 value. The gray arrow indicates a range of sub-kilometer size asteroids for assumed albedo pV = 0.24. |
6.1. CSS detection efficiency
The currently known population of asteroids represents a heterogeneous sample of bodies, each of which was discovered and/or detected by numerous surveys (e.g., Jedicke et al. 2015). Each of these surveys is equipped by different instruments, has a different observing strategy and maintains information about their performance at different level of public availability. For that reason, it is difficult to determine a unique detection efficiency Be that would be applicable globally to the whole dataset of asteroid observations. Instead, one has to restrict to one, well-understood survey for which all factors that may influence Be are available and could be properly modeled. In our case, we choose Catalina Sky Survey 2 (CSS) for which Be has been carefully studied and already successfully applied (e.g., Granvik et al. 2016).
The CSS has incorporated up to three telescopes in its asteroid survey network but only two of those telescopes provided the vast majority of asteroid discoveries − sites 703 and G96, both located near Tuscon, Arizona, USA. The two telescopes are complementary in the sense that the former small telescope surveys “wide and shallow” while the latter surveys “narrow and deep”.
We calculated the bias efficiency for Datura family members detected by the CSS using the technique described by Jedicke et al. (2016) with two modifications for this work. Their technique describes the calculation of a “bias correction” which is the sum of the orbital element detection efficiencies weighted by the true population distribution ( where j is a survey field index referring to either of the two CSS telescopes) and is applied to an observed population of objects that may include multiple detections. The method analytically determines the range of orbit elements for objects that could appear in a survey’s field of view and then calculates whether that particular object would actually be detected in the field (e.g., brighter than the system limiting magnitude and moving slower than the maximum detectable rate of motion). Our implementation in this work uses the “bias efficiency”
 ![Mathematical equation: \begin{equation} B_{\rm e}(a,e,I;H) \simeq 1 - \prod_j \left[1 - \bar\epsilon_j \left(a,e,I;H\right) \right] , \end{equation}](/articles/aa/full_html/2017/02/aa29670-16/aa29670-16-eq300.png) (3)that is always in the range [0,1] and is applied to a population of unique objects detected by a survey. In addition, we restricted the efficiency determination in orbit element space to the range of elements occupied by Datura family members since they are characterized by nearly identical (a,e,I) and a limited range in (Ω,ω). Specifically, Be was calculated for (a,e,I) = (2.24 au,0.21,5.99°) and only for the ranges 85.78° < Ω < 107.30° and 244.91° <ω< 277.38°, resulting in the absolute efficiency for detecting asteroids in that orbital element range. The application of the technique to debiasing the Datura size distribution requires the assumption that the members are randomly distributed in mean anomaly but this is reasonable because the Keplerian shear and Yarkovsky effect operates on a timescale orders of magnitude shorter than the age of the family.
(3)that is always in the range [0,1] and is applied to a population of unique objects detected by a survey. In addition, we restricted the efficiency determination in orbit element space to the range of elements occupied by Datura family members since they are characterized by nearly identical (a,e,I) and a limited range in (Ω,ω). Specifically, Be was calculated for (a,e,I) = (2.24 au,0.21,5.99°) and only for the ranges 85.78° < Ω < 107.30° and 244.91° <ω< 277.38°, resulting in the absolute efficiency for detecting asteroids in that orbital element range. The application of the technique to debiasing the Datura size distribution requires the assumption that the members are randomly distributed in mean anomaly but this is reasonable because the Keplerian shear and Yarkovsky effect operates on a timescale orders of magnitude shorter than the age of the family.
The resulting efficiency as a function of absolute magnitude (Fig. 15) suggests that there are no undiscovered Datura members larger than about H ≃ 15 mag (diameters D of about 2.7 km), because at least one of the two CSS telescopes would have detected the object by now. The survey detection efficiency drops to zero at about H ≃ 20 mag (D ≃ 0.27 km), just smaller than the smallest known Datura member detected by the CSS.
Datura family members detected by CSS.
6.2. Debiased Datura-family population
Since we have available the detection efficiency for the CSS operations in between 2005 and 2012, we can only use a sample of asteroids that were detected by this survey in the quoted time interval. Table 8 thus lists Datura-family members, except the largest fragment (1270) Datura, that were detected by either of the two CSS stations from 2005 through 2012. Compared to the whole set of members given in Table 7, we note that three single-opposition objects were not observed by CSS: 2003 UD112, 2006 SY376 and 2014 OE206. All of these cases are understandable: (i) the first and the last were detected in 2003 and 2014, outside the interval of time for which we have evaluated the CSS detection efficiency; and (ii) 2006 SY376 is just too faint. Hence, we must exclude these three bodies from the analysis in this Section. It may appear peculiar that 2014 OA86 is on our list, but we note this object has several precovery observations in September and November 2011 by G96. As a result, it is a valid object for our work. The same remark applies also to (433382) 2013 ST71.
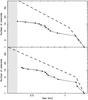 |
Fig. 16 Two examples of a satisfactory fit of the observed (gray line and symbols) and modeled (black line and symbols) populations of the Datura family (we show the population except for the largest fragment (1270) Datura). The unbiased, source population shown by the dashed line is assumed to have two power-law segments with cumulative exponents α (large sizes) and β (small sizes) and a break at Dbreak. In the two cases we have: (i) α = 5.36, β = 2.11 and Dbreak = 1.08 km (top); and (ii) α = 9.50, β = 2.09 and Dbreak = 1.24 km (bottom). The source population is transformed to the modeled population by the CSS detection efficiency function from Fig. 15. The magnitude-size relation assumes geometric albedo pV = 0.24, and the error bars of the observed population are from the magnitude uncertainties in Table 8. The smallest sizes denoted by the light-gray region are heavily biased against detection: B< 0.05 in this case. |
The first five objects on our list have been carefully observed and results were reported in Sect. 2. This allowed us to determine H with small uncertainty. However, the remaining objects were too faint and we were not able to observe them. In their case we adopted the following strategy. First, we note that our accurate H for brighter Datura objects are systematically larger than the magnitude values reported by Minor Planet Center (MPC) by 0.34 ± 0.05. This is a well understood mismatch discussed by Pravec et al. (2012). We assumed this correction applies also for fainter Datura members. Therefore the H values reported in Table 8 for these smaller objects (starting from 2002 RH291 on) are the MPC values augmented by 0.3. We also assigned an uncertainty of 0.25 to these values. This is the observed scatter of MPC H values in this size range (see Table 3 of Pravec et al. 2012).
Next, we need to characterize the true, unbiased population of Datura members. While we could use magnitude distribution as our fundamental quantity, conforming to the bias dependence on H, we opted to use size D distribution. This is a more traditional description of populations of fragments in asteroid families (e.g., Masiero et al. 2013, 2015; Nesvorný et al. 2015). In order to relate sizes D to magnitudes H, we use the conventional functional form D = 1329 × 10− 0.2H/ (e.g., Pravec & Harris 2007) with pV = 0.24 (Sect. 1).
We first attempted to use a single power-law distribution model for sizes of Datura members. However, we could not find any satisfactory solution for the power-law exponent and normalization that would relate this simplest template distribution to the observed population using the CSS detection efficiency from Sect. 6.1. Clearly, we need a slightly more complex model. Therefore, we next assumed a broken power-law size distribution. This is a composition of two power-law distributions of different slopes, α and β, joined at a size Dbreak that we call a break-point. In practice, we use a discrete model similar to that of Kresák (1977). This means that for D>Dbreak we set the fragment sizes Di equal to 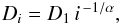 (4)where i = 1,2,3,... are positive integers and D1 is the largest fragment; α is therefore a slope of cumulative size distribution. We apply Eq. (4) until Di is smaller than Dbreak. From then on we keep increasing the index i, but use
 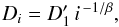 (5)with a recalibrated
 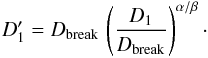 (6)This is the assumed small-size segment of Datura members characterized by a cumulative size distribution exponent β.
Taken straight, our model for the unbiased Datura population depends on four parameters: (i) (Dbreak;α,β) for the break-point size and the two exponents; and (ii) D1 the size of the largest fragment. While the former parameters determine the shape of the size distribution, the latter sets the normalization. Obviously, in practice we also have to assume some minimum size Dmin of the fragments. This is because the available data do not allow constraining the size distribution of Datura’s too small fragments. We set D1 equal to the size of the second largest known asteroid in the family, namely (90265) 2003 CL5. This nominally implies D1 = 1.49 km. In fact, we postulate that 2003 CL5 is truly the second largest fragment in the Datura family. We note that the CSS detection efficiency of bodies of its magnitude is ≃0.81 (Fig. 15). Therefore the chances that CSS, but also numerous other surveys, would have missed an asteroid larger than 2003 CL5 are very small. Indeed, all six largest asteroids in the family were discovered before 2003 (Table 8). The nominal size of the smallest asteroid in the sample detected by CSS is 0.41 km (2006 SD382). With δH ≃ 0.25, the formal (one sigma) uncertainty interval would be 0.37−0.46 km. We thus decided to take Dmin = 0.2 km.
Before we run a more systematic search of satisfactory solutions in our parametric space, we explain our procedure and show two nice examples in Fig. 16. The data from Table 8 are shown in gray. This is the target quantity for us. Our modeling effort starts with choosing a set (Dbreak;α,β) parameters. The corresponding synthetic Datura populations are shown by the dashed line. They, in fact, consist of a discrete set of typically tens to hundreds of test asteroids in our size limits D1 and Dmin generated by Eqs. (4) and (5). For each of the synthetic family-member of size Di we have the CSS detection efficiency Bi available. We take a Monte Carlo approach by drawing a random variate r: if r<Bi we consider the synthetic asteroid to be detected by CSS. This way we construct a set of synthetic, CSS-observed Datura family, which is to be compared to the observed family members in Table 8. To quantitatively evaluate the comparison between the modeled, biased Datura family and the observed one we: (i) impose that the two sets have the same number of asteroids (13 in our case); and (ii) run the Komogorov-Smirnov (KS) test of equality of the two distributions. We use numerical implementation in Press et al. (2007). Our accepted models have KS distance dKS< 0.1, which turns out to imply >99% likelihood of match between the simulated and observed families.
Both examples shown in Fig. 16 pass these tests. Nevertheless, we note that the inferred unbiased size distributions are quite different: the one on the top has much shallower α exponent, but smaller Dbreak value, which compensates the opposite trend in the one at the bottom. Already these two examples indicate that the currently available data will not be able to strongly constrain parameters of Datura’s size distribution function, except for general trends. For instance, α>β for all successful solutions. The steepness of α is needed to match the largest observed members, which shallowness of β is needed to explain paucity of known Datura members below ≃0.4 km in size. We note that our Dmin = 0.2 km is quite smaller than the smallest modeled body of typically 0.37−0.42 km size. This is only possible because of very small Be values for small sizes and not steeply increasing true population of Datura members (recall that Be becomes zero only at ≃0.27 km).
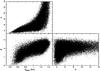 |
Fig. 17 Best-fit parameter sets (Dbreak;α,β) projected onto two dimensional planes: (i) Dbreak vs. α (top and left); (ii) Dbreak vs. β (bottom and left); and (iii) α vs. β (bottom and right). Symbols correspond to parameters that provided matches with the Kolmogorov-Smirnov distance dKS< 0.1 between the observed and modeled (biased) populations of Datura fragments. |
We conducted a systematic search of successful solutions in the parametric space (Dbreak;α,β) with the following interval of values: (i) Dbreak ∈ (Dmin,D1); (ii) α ∈ (3,13); and (iii) β ∈ (0,3.5). Each of the parameters was represented by a grid of 1501 values, making altogether >3.375 × 10⁹ combinations. For each of these combinations we also created 50 realizations of sizes of the observed Datura members based on the nominal H values and their uncertainty reported in Table 8. In each of these cases we have slightly different size of (90265) 2003 CL5 which individually sets D1 in that run. This brings us to more than 1.68 × 10¹¹ simulations.
Figure 17 shows the combinations of successful solutions projected onto two dimensional sub-spaces in (Dbreak;α,β). None of the parameters is well constrained and many combinations could lead to a good match of the data. This is because the available dataset is still rather limited. As mentioned above, only general trends can be observed: for instance, larger Dbreak values may support quite steep α solutions, but when Dbreak becomes smaller this must be compensated by shallower β (to prevent over-prediction of number of detected asteroids).
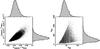 |
Fig. 18 Left: correlated values of angular momentum vs mass content in Datura fragments (except for 1270 Datura) normalized by the angular momentum and mass of (1270) Datura. Symbols correspond to successful fits from Fig. 17. The shaded histograms on the top and on the right are one dimensional distributions of the respective quantity. Right: the same as on the left, but now showing true (debiased) number N500 of Datura-family fragments larger than 500 m vs number N200 of Datura-family fragments larger than 200 m in size. Magnitude-size transformation assumes albedo pV = 0.24. |
While details of the size distribution of Datura members cannot be presently constrained, some global parameters of interest can be evaluated. For instance, one can estimate total mass in the fragments mfragments and compare it with the total mass of the largest remnant (1270) Datura mDatura. Assuming constant and all-equal bulk density, we have 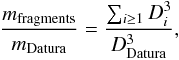 (7)where the summation in the numerator of the right hand side runs over all modeled Datura members. Obviously, we are only able to characterize the population down to the smallest size Dmin. However, because the β values are nearly always smaller than the critical limit 3 (for which mass in the population will start being dominated by small members), this limitation does not influence our results.
Similarly, we are interested in rotational angular momentum content in the fragments Lfragments compared to that of (1270) Datura LDatura. Their ratio can be estimated as  (8)where ωi are angular frequency of rotation of the ith fragment. For simplicity we use spherical approximation for the fragments, but we believe our general conclusions are not changed even if more involved approximations is adopted. From Vokrouhlický et al. (2009) and Sect. 3 we know ωDatura and ωi for the largest fragments, but we do not know their value for small members in the Datura family. As we want to probe maximum possible Lfragments, we shall assume all fragments with unknown rotation state have a period of 2 h, and correspondingly maximum value of ωi.
Figure 18 shows the results. On the left we give Lfragments/LDatura vs. mfragments/mDatura. Each datapoint corresponds to one of the successful fits from Fig. 17. Interestingly, both values are much smaller than unity, with the following statistical values: mfragments/mDatura = 0.045 ± 0.009 and Lfragments/LDatura = (1.03 ± 0.33) × 10-3. Therefore nominally, Datura-forming event should be classified as a cratering (e.g., Durda et al. 2007). Additional circumstance here is that the largest remnant holds not only most of the mass of the parent body, but it also retained most of its angular momentum. Obviously, we were able to evaluate only the rotational component of the angular momentum. There was also orbital part of the angular momentum of escaping ejecta in the family forming event that cannot be constraint by our data. Here we assume that, as a rule of thumb, this part was comparable to the rotational part.
Another information of observational interest that can be inferred from our simulation is the true number of Datura members above some size limit. As an example we used results from Fig. 17 and for each of the successful model evaluated number N500 of family-members larger than 500 m and number N200 of family-members larger than 200 m. The right panel of Fig. 18 shows our estimates, or in quantitative terms N500 = 45 ± 12 and N200 = 304 ± 164.
7. Discussion and conclusions
The results presented in this paper may offer an important constrain on the formation model of the Datura family, and perhaps also other families of the similar size category. For instance, we observed that several of the largest members, except for (1270) Datura, have a slow rotation and a very elongated shape. Additionally, in the three cases discussed in Sects. 4.1 to 4.3 we found a similar orientation of the rotation pole to the largest fragment (1270) Datura. Convex shapes of (90265) 2003 CL5 and (89309) 2001 VN36 are extremely elongated and we suspect the true nature of these bodies may consist of two components resting on each other, perhaps as a result of a faked binary at the moment of family formation. We also note that (215619) 2003 SQ168 is the only exception among our observed sample of small Datura members, since it has rather fast rotation and low amplitude of the lightcurve (likely near-spherical shape). In the same time, this asteroid resides on an orbit that most closely resembles that of (1270) Datura. For that reason Vokrouhlický & Nesvorný (2008) even considered them a separate pair of objects. A successful formation scenario of the Datura family must satisfy all these results emerging from observation of individual Datura members.
Additionally, our analysis provides also an important population-wise constraint. This is because, compared to classical asteroid families, the debiased distribution of fragments in the Datura family, as derived in Sect. 6, is rather shallow. Compare it, for instance, with the steep size distribution of the somewhat older Karin family (e.g., Nesvorný et al. 2006a). In quantitative terms we note that we have basically two solutions for Datura’s size distribution (see Figs. 16 and 17): (i) either a steep leg at large sizes is very brief and Dbreak ≥ 1 km, followed with very shallow β in the range ≃(1−3); or (ii) there is more extended single power-law leg at large sizes and Dbreak ≤ 0.66 km, but then α ≤ 5 followed by very shallow β ≤ 2. In Karin, the size distribution of fragments smaller than (832) Karin is steep with equivalent αKarin ≃ 5.3 over a size range of at least 2−5 km (and may well continue below 2 km to kilometer of sub-kilometer sizes). We also find it interesting that the largest fragment (1270) Datura retained most of the mass and angular momentum of the parent body, and is still rotating near the critical, fission limit. As a result, the Datura family is to be considered an example of cratering event, rather then the catastrophic disruption event. Fragments in cratering events of large families, such as Vesta or Massalia, are known to have very steep size distribution, steeper than that of the Karin family. All these clues make us speculate that the formation of the Datura family underwent somewhat different regime than the traditional, larger and older asteroid families. We think that the Datura family may result from a collision of a comparably smaller projectile onto a near-to-critically rotating parent body. Numerical simulations of asteroid collisional fragmentations have not explored this interesting regime yet, but the very young asteroid families may provide a strong motivation to do so.
We note that population of asteroids with size ≤30 km was found to be strongly affected by the Yarkovsky-O’Keefe-Radzievsky-Paddack (YORP) effect (e.g., Bottke et al. 2006; Vokrouhlický et al. 2015). In particular, YORP is able to accelerate rotation rate of asteroids and make part of the population rotate very fast (e.g., Pravec et al. 2008). Although this is only a fraction of the whole population, it may be vulnerable to an easier disruption, or undergo significant cratering, by impacts of small projectiles. Therefore, breakups of this particular sub-population of fast rotating asteroids may represent a significant portion of family-formation events with parent bodies of Dpar ≤ 30 km size.
Acknowledgments
We thank the referee Valerio Carruba for helpful suggestions that improved the original version of this paper. This work was supported by the Czech Science Foundation (grants GA13-01308S and P209-12-0229). This research was based in part on data obtained at the Lowell Observatory’s Discovery Channel Telescope (DCT). Lowell operates the DCT in partnership with Boston University, Northern Arizona University, the University of Maryland, and the University of Toledo. Partial support of the DCT was provided by Discovery Communications. LMI was built by Lowell Observatory using funds from the National Science Foundation (AST-1005313). A. Thirouin, and N. Moskovitz acknowledge funding from Lowell Observatory.
References
- Bottke, W. F., Vokrouhlický, D., Rubincam, D. P., & Nesvorný, D. 2006, Ann. Rev. Earth Planet. Sci., 34, 157 [Google Scholar]
- Bowell, E., Oszkiewicz, D. A., Wasserman, L., et al. 2011, in EPSC-DPS Joint Meeting 2011, 1549 [Google Scholar]
- Breiter, S., Rożek, A., & Vokrouhlický, D. 2012, MNRAS, 427, 755 [NASA ADS] [CrossRef] [Google Scholar]
- Brouwer, D. 1951, AJ, 56, 9 [NASA ADS] [CrossRef] [Google Scholar]
- Carruba, V., Aljbaae, S., & Winter, O. C. 2016a, MNRAS, 455, 2279 [NASA ADS] [CrossRef] [Google Scholar]
- Carruba, V., Nesvorný, D., & Vokrouhlický, D. 2016b, AJ, 151, 164 [NASA ADS] [CrossRef] [Google Scholar]
- Durda, D. D., Bottke, W. F., Nesvorný, D., et al. 2007, Icarus, 186, 498 [NASA ADS] [CrossRef] [Google Scholar]
- Ďurech, J., Carry, B., Delbò, M., Kaasalainen, M., & Viikinkoski, M. 2015, in Asteroids IV, eds. P. Michel, F. E. DeMeo, & W. F. Bottke (Tucson: University of Arizona Press), 183 [Google Scholar]
- Granvik, M., Morbidelli, A., Jedicke, R., et al. 2016, Nature, 530, 303 [Google Scholar]
- Harris, A. W. 1994, Icarus, 107, 209 [NASA ADS] [CrossRef] [Google Scholar]
- Harris, A. W., Young, J. W., Bowell, E., et al. 1989, Icarus, 77, 171 [NASA ADS] [CrossRef] [Google Scholar]
- Harris, A. W., Pravec, P., Galád, A., et al. 2014, Icarus, 235, 55 [NASA ADS] [CrossRef] [Google Scholar]
- Hirayama, K. 1918, AJ, 31, 185 [NASA ADS] [CrossRef] [Google Scholar]
- Hirayama, K. 1922, Jap. J. Astron. Geophys., 1, 55 [Google Scholar]
- Jedicke, R., Bolin, B., Granvik, M., & Beshore, E. 2016, Icarus, 266, 173 [NASA ADS] [CrossRef] [Google Scholar]
- Jedicke, R., Granvik, M., Micheli, M., et al. 2015, in Asteroids IV, eds. P. Michel, F. E. DeMeo, & W. F. Bottke (Tucson: University of Arizona Press), 795 [Google Scholar]
- Kaasalainen, M., Torppa, J., & Muinonen, K. 2001, Icarus, 153, 37 [NASA ADS] [CrossRef] [Google Scholar]
- Kaasalainen, M., Mottola, S., & Fulchignoni, M. 2002, in Asteroid III, eds. W. F. Bottke, Jr., A. Cellino, P. Paolicchi, & R. P. Binzel (Tucson: University of Arizona Press), 139 [Google Scholar]
- Knežević, Z., Lemaître, A., & Milani, A. 2002, in Asteroids III, ed. W. F. Bottke, A. Cellino, P. Paolicchi, & R. P. Binzel (Tucson: University of Arizona Press), 603 [Google Scholar]
- Kresák, L. 1977, Bull. Astron. Instit. Czechoslovakia, 28, 65 [NASA ADS] [Google Scholar]
- Landolt, A. U. 1992, AJ, 104, 340 [NASA ADS] [CrossRef] [Google Scholar]
- Levine, S. E., Bida, T. A., Chylek, T., et al. 2012, in Ground-based and Airborne Telescopes IV, Proc. SPIE, 8444, 844419 [CrossRef] [Google Scholar]
- Masiero, J. R., Mainzer, A. K., Grav, T., et al. 2012, ApJ, 759, L8 [NASA ADS] [CrossRef] [Google Scholar]
- Masiero, J. R., Mainzer, A. K., Bauer, J. M., et al. 2013, ApJ, 770, 7 [NASA ADS] [CrossRef] [Google Scholar]
- Masiero, J. R., DeMeo, F. E., Kasuga, T., & Parker, A. H. 2015, in Asteroids IV, eds. P. Michel, F. E. DeMeo, & W. F. Bottke (Tucson: University of Arizona Press), 323 [Google Scholar]
- Milani, A., & Knežević, Z. 1994, Icarus, 107, 219 [NASA ADS] [CrossRef] [Google Scholar]
- Mothé-Diniz, T., & Nesvorný, D. 2008, A&A, 486, L9 [NASA ADS] [CrossRef] [EDP Sciences] [Google Scholar]
- Nesvorný, D., & Bottke, W. F. 2004, Icarus, 170, 324 [NASA ADS] [CrossRef] [Google Scholar]
- Nesvorný, D., & Vokrouhlický, D. 2006, AJ, 132, 1950 [NASA ADS] [CrossRef] [Google Scholar]
- Nesvorný, D., Bottke, W. F., Dones, L., & Levison, H. F. 2002, Nature, 417, 720 [NASA ADS] [CrossRef] [Google Scholar]
- Nesvorný, D., Enke, B. L., Bottke, W. F., et al. 2006a, Icarus, 183, 296 [NASA ADS] [CrossRef] [Google Scholar]
- Nesvorný, D., Vokrouhlický, D., & Bottke, W. F. 2006b, Science, 312, 1490 [NASA ADS] [CrossRef] [Google Scholar]
- Nesvorný, D., Brož, M., & Carruba, V. 2015, in Asteroids IV, eds. P. Michel, F. E. DeMeo, & W. F. Bottke (Tucson: University of Arizona Press), 297 [Google Scholar]
- Polishook, D., Moskovitz, N., Binzel, R. P., et al. 2014, Icarus, 233, 9 [NASA ADS] [CrossRef] [Google Scholar]
- Pravec, P., & Harris, A. W. 2007, Icarus, 190, 250 [CrossRef] [Google Scholar]
- Pravec, P., & Vokrouhlický, D. 2009, Icarus, 204, 580 [NASA ADS] [CrossRef] [Google Scholar]
- Pravec, P., Šarounová, L., & Wolf, M. 1996, Icarus, 124, 471 [NASA ADS] [CrossRef] [Google Scholar]
- Pravec, P., Hergenrother, C., Whiteley, R., et al. 2000, Icarus, 147, 477 [NASA ADS] [CrossRef] [Google Scholar]
- Pravec, P., Harris, A. W., Vokrouhlický, D., et al. 2008, Icarus, 197, 497 [NASA ADS] [CrossRef] [Google Scholar]
- Pravec, P., Vokrouhlický, D., Polishook, D., et al. 2010, Nature, 466, 1085 [NASA ADS] [CrossRef] [Google Scholar]
- Pravec, P., Harris, A. W., Kušnirák, P., Galád, A., & Hornoch, K. 2012, Icarus, 221, 365 [NASA ADS] [CrossRef] [Google Scholar]
- Pravec, P., Scheirich, P., Ďurech, J., et al. 2014, Icarus, 233, 48 [NASA ADS] [CrossRef] [Google Scholar]
- Press, W. H., Teukolsky, S. A., Vetterling, W. T., & Flannery, B. P. 2007, Numerical Recipes: The Art of Scientific Computing (Cambridge: Cambridge University Press) [Google Scholar]
- Rosaev, A., & Plavalova, E. 2015, ArXiv e-prints [arXiv:1509.00975] [Google Scholar]
- Sharma, I., Burns, J. A., & Hui, C.-Y. 2005, MNRAS, 359, 79 [NASA ADS] [CrossRef] [Google Scholar]
- Stetson, P. B. 1987, PASP, 99, 191 [NASA ADS] [CrossRef] [Google Scholar]
- Takato, N. 2008, ApJ, 685, L161 [NASA ADS] [CrossRef] [Google Scholar]
- Thirouin, A., Noll, K. S., Ortiz, J. L., & Morales, N. 2014, A&A, 569, A3 [NASA ADS] [CrossRef] [EDP Sciences] [Google Scholar]
- Thirouin, A., Sheppard, S. S., Noll, K. S., et al. 2016, AJ, 151, 148 [NASA ADS] [CrossRef] [Google Scholar]
- Vernazza, P., Binzel, R. P., Rossi, A., Fulchignoni, M., & Birlan, M. 2009, Nature, 458, 993 [NASA ADS] [CrossRef] [Google Scholar]
- Vokrouhlický, D. 1999, A&A, 344, 362 [NASA ADS] [Google Scholar]
- Vokrouhlický, D., & Nesvorný, D. 2008, AJ, 136, 280 [NASA ADS] [CrossRef] [Google Scholar]
- Vokrouhlický, D., & Nesvorný, D. 2011, AJ, 142, 26 [NASA ADS] [CrossRef] [Google Scholar]
- Vokrouhlický, D., Nesvorný, D., & Bottke, W. F. 2006, Icarus, 184, 1 [NASA ADS] [CrossRef] [Google Scholar]
- Vokrouhlický, D., Ďurech, J., Michałowski, T., et al. 2009, A&A, 507, 495 [NASA ADS] [CrossRef] [EDP Sciences] [Google Scholar]
- Vokrouhlický, D., Bottke, W. F., Chesley, S. R., Scheeres, D. J., & Statler, T. S. 2015, in Asteroids IV, eds. P. Michel, F. E. DeMeo, & W. F. Bottke (Tucson: University of Arizona Press), 509 [Google Scholar]
- Vokrouhlický, D., Ďurech, J., Pravec, P., et al. 2016, AJ, 151, 56 [NASA ADS] [CrossRef] [Google Scholar]
- Warner, B. D., Harris, A. W., & Pravec, P. 2009, Icarus, 202, 134 [NASA ADS] [CrossRef] [Google Scholar]
- Wisniewski, W. Z., Michałowski, T. M., Harris, A. W., & McMillan, R. S. 1997, Icarus, 126, 395 [NASA ADS] [CrossRef] [Google Scholar]
All Tables
Aspect data for observations of (203370) 2001 WY35, (215619) 2003 SQ168, and 2002 RH292.
Known rotation parameters from lightcurve observations of Datura family members.
Equinoctial orbital elements, and their uncertainty, of the Datura family members as of epoch MJD 57 400.0.
All Figures
|
Fig. 1 Composite lightcurve of (203370) 2001 WY35 from 2014. The solid line is the fit fourth-order Fourier series representing the data. |
| In the text | |
|
Fig. 2 Composite lightcurve of (215619) 2003 SQ168 from 2013. The solid line is the fit fifth-order Fourier series representing the data. |
| In the text | |
|
Fig. 3 Composite lightcurve of (215619) 2003 SQ168 from 2015. The solid line is the fit second-order Fourier series showing that there is a low-amplitude signal for the period obtained from the 2013 data. The exact ligthcurve shape is not well revealed due to noisy 2015 observations that were taken close to the aphelion of the asteroid’s orbit (see Table 1). |
| In the text | |
|
Fig. 4 Partial lightcurve of 2002 RH291 from July 8, 2015 observations. A high amplitude of 1.2 mag is revealed and a period about 5.3 h is suggested. |
| In the text | |
|
Fig. 5 The convex shape model of (90265) 2003 CL5, corresponding to the formally best-fit pole orientation, shown from equatorial level (left and center, 90° apart) and pole-on (right). |
| In the text | |
|
Fig. 6 Example lightcurves of (90265) 2003 CL5 (dots) shown with the synthetic lightcurves (solid curves) produced by the best-fit model in Fig. 5. The geometry is described by the aspect angle θ, the solar aspect angle θ0, and the solar phase angle α. |
| In the text | |
|
Fig. 7 The shape model of (60151) 1999 UZ6 corresponding to the pole direction (λ,β) = (18°,56°) shown from equatorial level (left and center, 90° apart) and pole-on (right). |
| In the text | |
|
Fig. 8 Example lightcurves of (60151) 1999 UZ6 (dots) shown with the synthetic lightcurves (solid curves) produced by the best-fit model in Fig. 7. The geometry is described by the aspect angle θ, the solar aspect angle θ0, and the solar phase angle α and corresponds to the pole direction (λ,β) = (18°,56°). |
| In the text | |
|
Fig. 9 The shape model of (89309) 2001 VN36 corresponding to the pole direction (λ,β) = (66°,63°) shown from equatorial level (left and center, 90° apart) and pole-on (right). |
| In the text | |
|
Fig. 10 Left: observed (blue) and modeled (red) data of (89309) 2001 VN36 shown as a function of the solar phase angle (abscissa, in degrees). Right: the residuals plotted with respect to the mean phase curve (dashed line). |
| In the text | |
|
Fig. 11 Datura family members with proper orbital elements determined by the AstDyS database projected onto two-dimensional planes of proper semimajor axis vs. proper sine of inclination (top), and proper semimajor axis vs. proper eccentricity (bottom). Formal one sigma uncertainties are shown by error bars. The large diamond symbol shows the largest family member (1270) Datura. The dashed ellipse shows orbits at 6 m s-1 distance from (1270) Datura and ω + f = 30° and f = 40° at the moment of family formation (ω is argument of perihelion and f is the true anomaly). The gray interval of semimajor axis values approximately delimits the zone of the M9/16 mean motion resonance with Mars. Some Datura members, 433382, 89309 and 2009 VS116 from bottom to top, reside in this resonance. One asteroid, 452713, appears to jump over this resonance and resides on the extreme right of the plot. All these members have formally large distance δvprop> 12 m s-1 distance to (1270) Datura in the standard metric of the proper element space. |
| In the text | |
|
Fig. 12 Correlation between osculating longitude of node Ω (abscissa) and longitude of perihelion ϖ (ordinate) for Datura members. Large diamond is (1270) Datura, black symbols are for multi-opposition members and gray symbols are for single-opposition members. Formal one sigma uncertainty of Ω and ϖ are shown by error-bars, often smaller than the symbols. The open symbols are for asteroids 2015 DY94 (left) and 2015 PQ47 (right) whose orbits are very uncertain at this moment. The dashed line has a slope ≃−0.5. Asteroids with negative difference ΔΩ with respect to (1270) Datura have larger value of the proper semimajor axis and vice versa. Those with ΔΩ approximately in between −12° and −5° are captured in the M9/16 mean motion resonance with Mars. |
| In the text | |
|
Fig. 13 Convergence of secular angles Ω and ϖ of Datura members to the largest fragment (1270) Datura. The histograms show number of converging trials in the past regrouped into 10 kyr bins: (i) light gray for a cut-off limit δV< 5 m s-1; (ii) the dark gray for a cut-off limit δV< 2 m s-1. Each time the histograms were normalized to unity for the first case. Left and middle columns for asteroids on stable orbits away from the M9/16 mean motion resonance. The right column for objects that either currently reside in this resonance (89309, 433382 and 2009 VS116), or the extreme member that jumped over this resonance (452713). |
| In the text | |
|
Fig. 14 Same as in Fig. 13, but now using the second of our convergence criteria. In this case we monitored distance of the (1270) Datura clones from those of family members in Cartesian space and in the same time evaluated their relative velocity. When both quantities became smaller than chosen threshold values, ideally the estimated radius of the Hill sphere of Datura-family parent body and its escape velocity, we considered the configuration converging. The light gray histograms show normalized appearance of converging cases in 10 kyr bins for distance limit of 5000 km and the velocity limit of 10 m s-1. The dark gray cases have instead 2500 km and 5 m s-1 limits. |
| In the text | |
|
Fig. 15 Detection efficiency function Be characterizing performance of the two stations at Catalina Sky Survey: the 1.5-m Mt. Lemmon telescope (code G96) and 0.8-m Catalina telescope (code 703). The smaller of the two covers larger area of the sky, allowing a nearly complete census of brighter members in the Datura family. The detection efficiency drops below 0.5 at ≃16.8 mag, mainly due to performance of station 703. The non-negligible detection-efficiency tail to fainter objects of a magnitude up to 20 is due to observations of the larger, Mt. Lemmon telescope. Because the station G96 searches a smaller sky area near ecliptic, it could miss some orbits and the efficiency stays below 0.2 value. The gray arrow indicates a range of sub-kilometer size asteroids for assumed albedo pV = 0.24. |
| In the text | |
|
Fig. 16 Two examples of a satisfactory fit of the observed (gray line and symbols) and modeled (black line and symbols) populations of the Datura family (we show the population except for the largest fragment (1270) Datura). The unbiased, source population shown by the dashed line is assumed to have two power-law segments with cumulative exponents α (large sizes) and β (small sizes) and a break at Dbreak. In the two cases we have: (i) α = 5.36, β = 2.11 and Dbreak = 1.08 km (top); and (ii) α = 9.50, β = 2.09 and Dbreak = 1.24 km (bottom). The source population is transformed to the modeled population by the CSS detection efficiency function from Fig. 15. The magnitude-size relation assumes geometric albedo pV = 0.24, and the error bars of the observed population are from the magnitude uncertainties in Table 8. The smallest sizes denoted by the light-gray region are heavily biased against detection: B< 0.05 in this case. |
| In the text | |
|
Fig. 17 Best-fit parameter sets (Dbreak;α,β) projected onto two dimensional planes: (i) Dbreak vs. α (top and left); (ii) Dbreak vs. β (bottom and left); and (iii) α vs. β (bottom and right). Symbols correspond to parameters that provided matches with the Kolmogorov-Smirnov distance dKS< 0.1 between the observed and modeled (biased) populations of Datura fragments. |
| In the text | |
|
Fig. 18 Left: correlated values of angular momentum vs mass content in Datura fragments (except for 1270 Datura) normalized by the angular momentum and mass of (1270) Datura. Symbols correspond to successful fits from Fig. 17. The shaded histograms on the top and on the right are one dimensional distributions of the respective quantity. Right: the same as on the left, but now showing true (debiased) number N500 of Datura-family fragments larger than 500 m vs number N200 of Datura-family fragments larger than 200 m in size. Magnitude-size transformation assumes albedo pV = 0.24. |
| In the text | |
Current usage metrics show cumulative count of Article Views (full-text article views including HTML views, PDF and ePub downloads, according to the available data) and Abstracts Views on Vision4Press platform.
Data correspond to usage on the plateform after 2015. The current usage metrics is available 48-96 hours after online publication and is updated daily on week days.
Initial download of the metrics may take a while.