Fig. 16
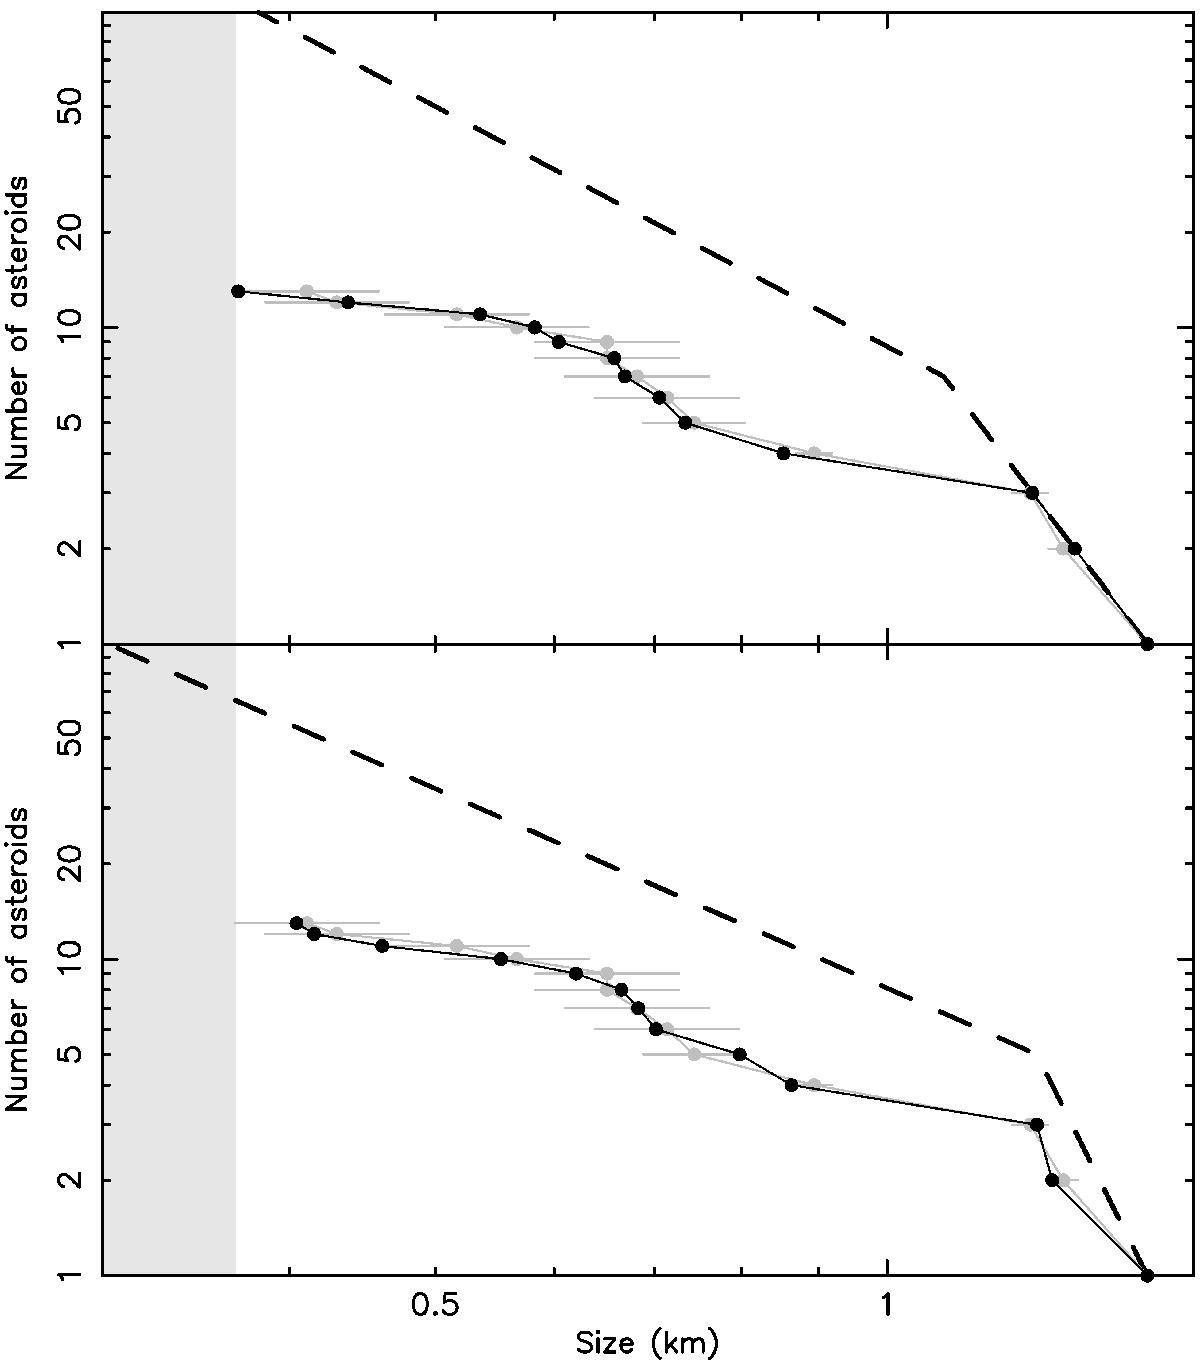
Two examples of a satisfactory fit of the observed (gray line and symbols) and modeled (black line and symbols) populations of the Datura family (we show the population except for the largest fragment (1270) Datura). The unbiased, source population shown by the dashed line is assumed to have two power-law segments with cumulative exponents α (large sizes) and β (small sizes) and a break at Dbreak. In the two cases we have: (i) α = 5.36, β = 2.11 and Dbreak = 1.08 km (top); and (ii) α = 9.50, β = 2.09 and Dbreak = 1.24 km (bottom). The source population is transformed to the modeled population by the CSS detection efficiency function from Fig. 15. The magnitude-size relation assumes geometric albedo pV = 0.24, and the error bars of the observed population are from the magnitude uncertainties in Table 8. The smallest sizes denoted by the light-gray region are heavily biased against detection: B< 0.05 in this case.
Current usage metrics show cumulative count of Article Views (full-text article views including HTML views, PDF and ePub downloads, according to the available data) and Abstracts Views on Vision4Press platform.
Data correspond to usage on the plateform after 2015. The current usage metrics is available 48-96 hours after online publication and is updated daily on week days.
Initial download of the metrics may take a while.