Fig. 2
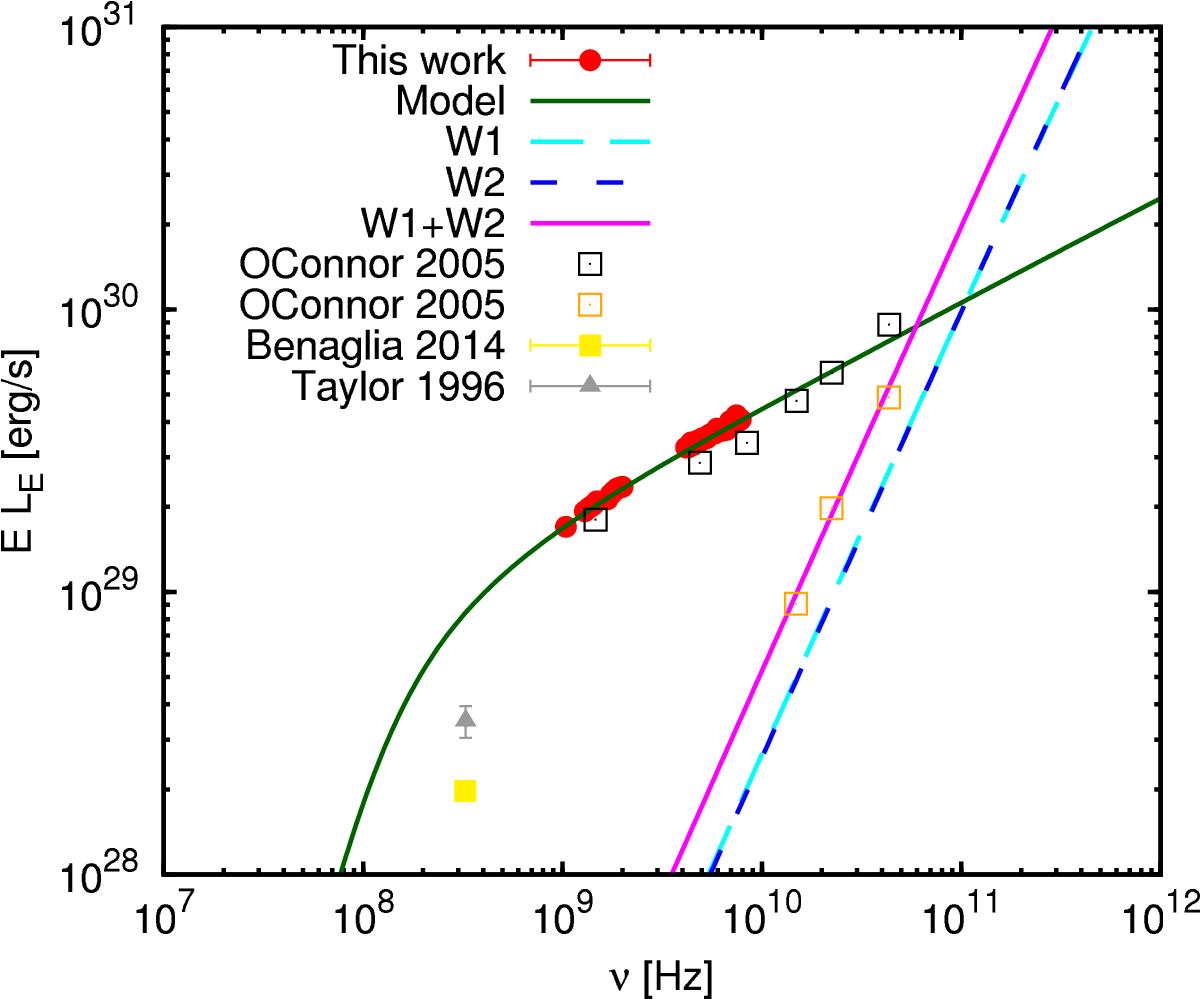
Luminosities in the 20 cm and 5 cm bands from our per spectral window data (red points). The solid green curve is the simulated emission considering acceleration by MR, and synchrotron emission suffering free-free absorption in the stellar wind. We also include data points from Taylor et al. (1996) (grey triangle) and Benaglia & Ishwara-Chandra (priv. comm., observed in Oct. 2014, yellow circle), and from O’Connor et al. (2005) for the total flux density (dark grey squares) and the WR emission (orange squares). The straight lines represent the separated (dashed) and summed (solid) free-free emission from the winds using Eq. (8) from Wright & Barlow (1975).
Current usage metrics show cumulative count of Article Views (full-text article views including HTML views, PDF and ePub downloads, according to the available data) and Abstracts Views on Vision4Press platform.
Data correspond to usage on the plateform after 2015. The current usage metrics is available 48-96 hours after online publication and is updated daily on week days.
Initial download of the metrics may take a while.