Fig. 1
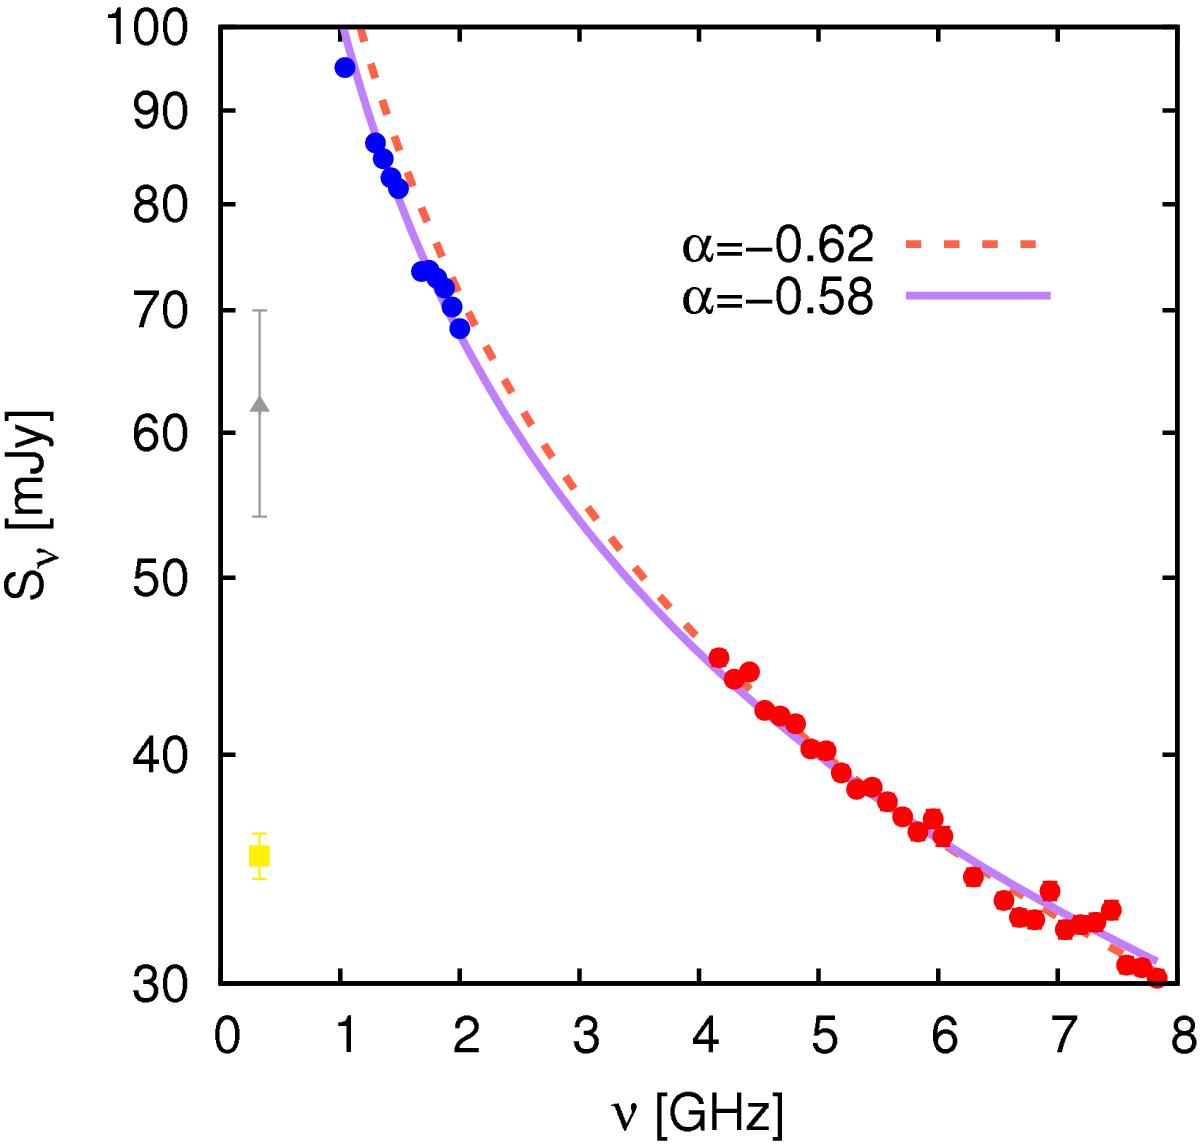
Radio observations at L-band (blue points) and C-band (red points). We show the spectral fit Sν ∝ να to the whole data set (solid purple line) and only to the C-band data (dashed orange line). We also show the flux densities measured at 327 MHz by Taylor et al. (1996) (grey triangle) and Benaglia & Ishwara-Chandra (priv. comm., observed in Oct. 2014, yellow square).
Current usage metrics show cumulative count of Article Views (full-text article views including HTML views, PDF and ePub downloads, according to the available data) and Abstracts Views on Vision4Press platform.
Data correspond to usage on the plateform after 2015. The current usage metrics is available 48-96 hours after online publication and is updated daily on week days.
Initial download of the metrics may take a while.