Fig. 2
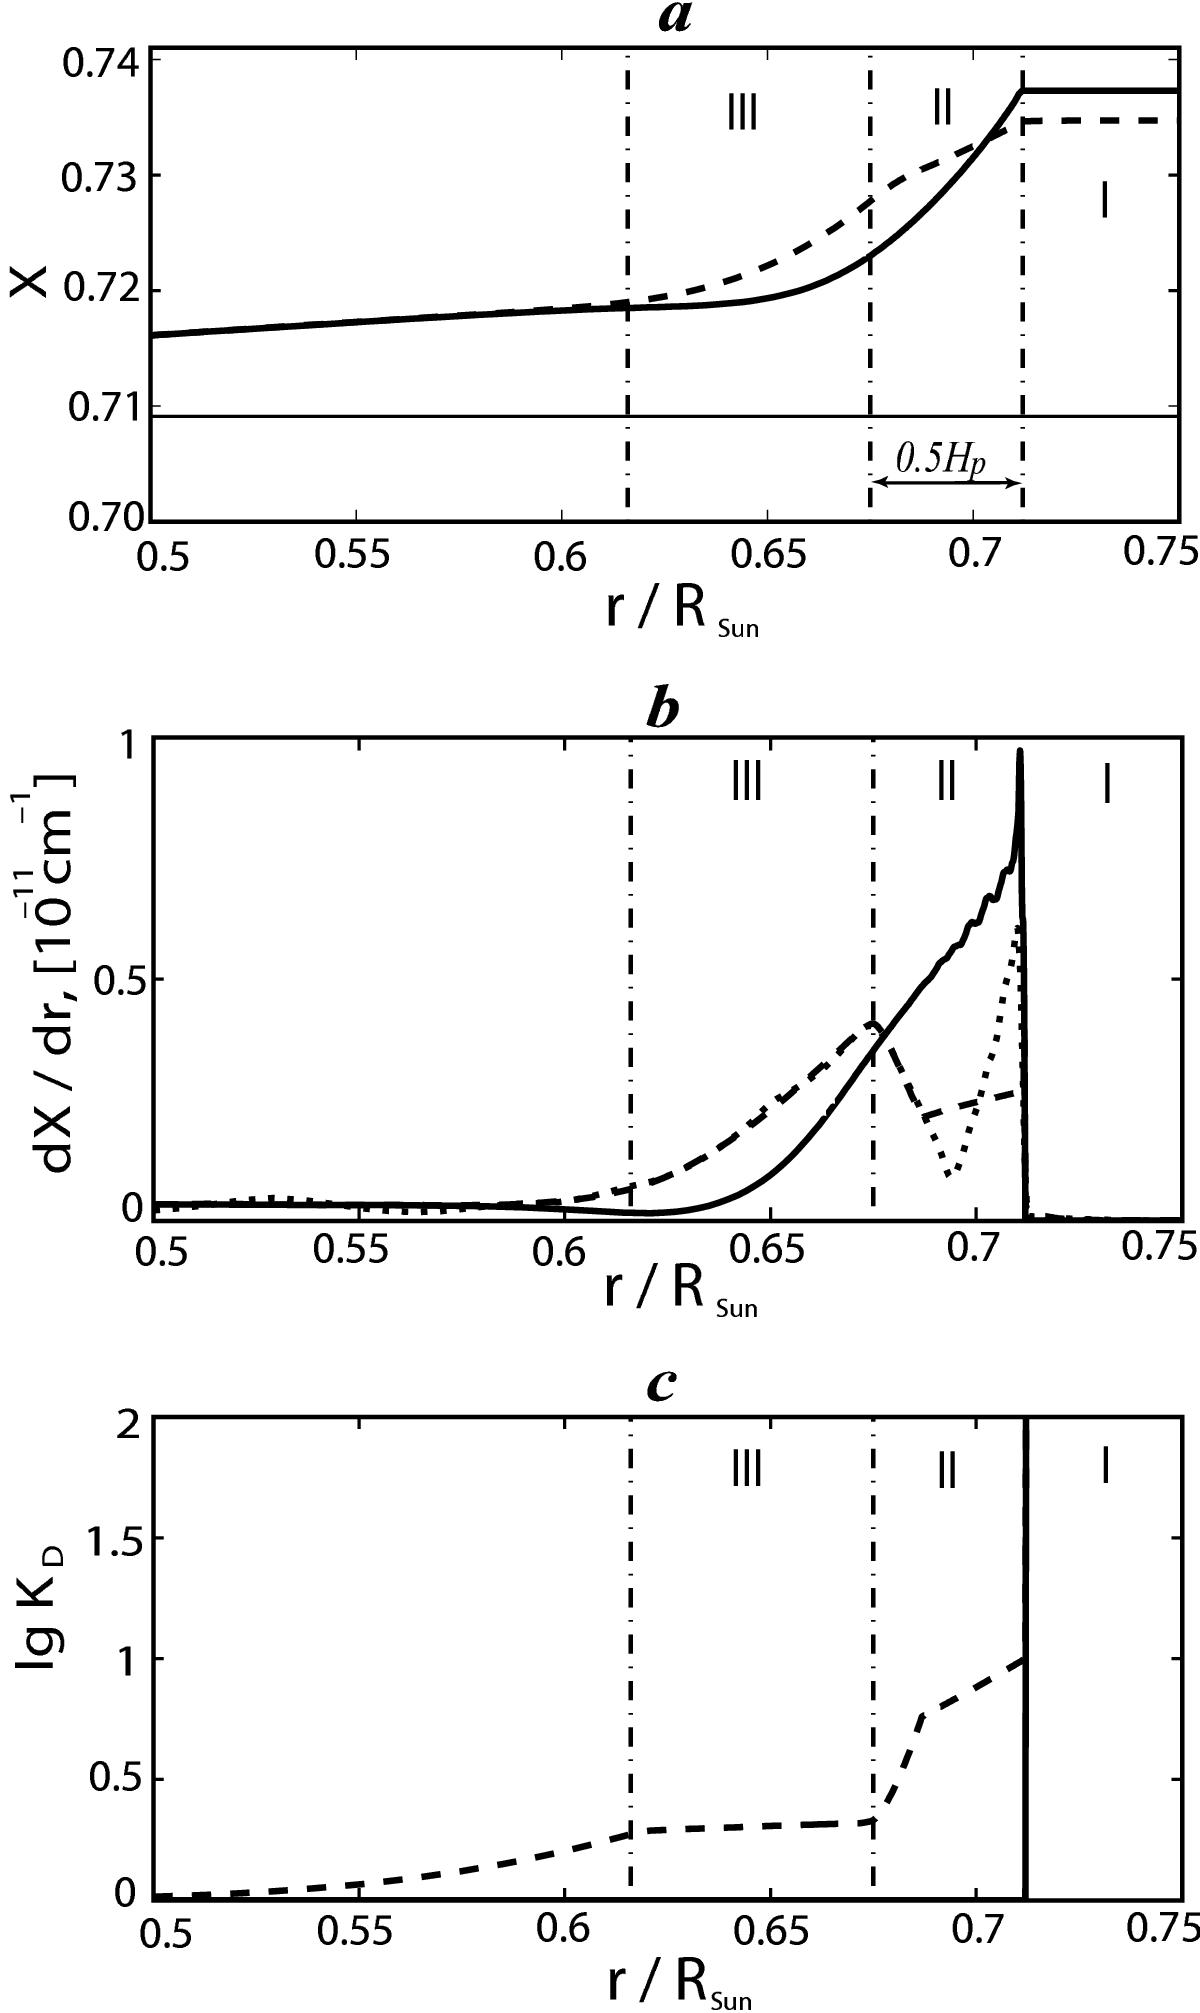
Profiles of hydrogen abundance a), its gradient b) and coefficient KDc) beneath the convection zone in the present-day Sun. Dashed and solid lines describe the model with and without additional mixing, respectively. The thin, solid, horizontal line on the plot a) is hydrogen distribution at the ZAMS. The pointed line on the plot b) is inverted gradient of hydrogen abundance obtained from the observed sound-speed profile. Vertical dashed-pointed lines separate three regions with different mixing: I is convection zone, II and III are zones with additional mixing.
Current usage metrics show cumulative count of Article Views (full-text article views including HTML views, PDF and ePub downloads, according to the available data) and Abstracts Views on Vision4Press platform.
Data correspond to usage on the plateform after 2015. The current usage metrics is available 48-96 hours after online publication and is updated daily on week days.
Initial download of the metrics may take a while.