Fig. 4
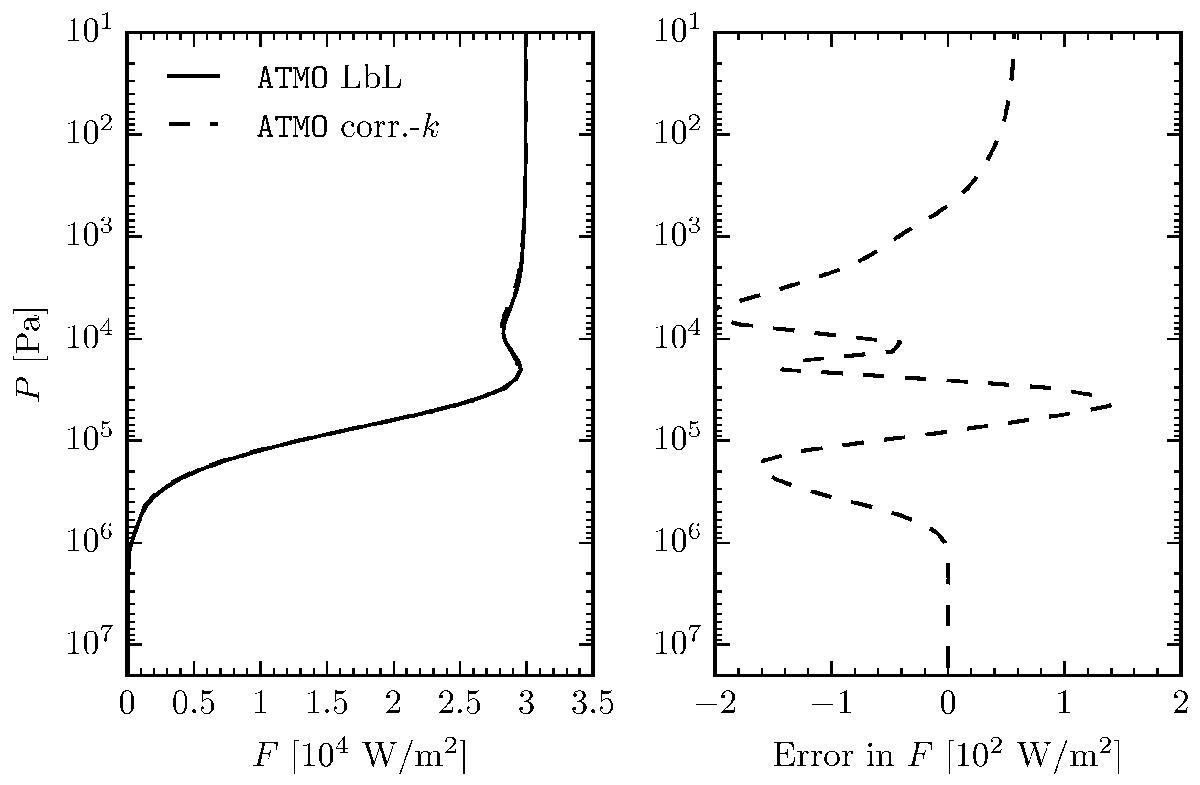
Fluxes (left) and absolute errors in fluxes (right) for the night side P–T profile in Fig. 3. The line-by-line (LbL) calculation was run at a 0.001 cm-1 resolution corresponding to 5 × 10⁷ monochromatic calculations, while we used 120 rebinned k-coefficients in each band corresponding to 3840 pseudo-monochromatic calculations. Both results were obtained using ATMO.
Current usage metrics show cumulative count of Article Views (full-text article views including HTML views, PDF and ePub downloads, according to the available data) and Abstracts Views on Vision4Press platform.
Data correspond to usage on the plateform after 2015. The current usage metrics is available 48-96 hours after online publication and is updated daily on week days.
Initial download of the metrics may take a while.