| Issue |
A&A
Volume 598, February 2017
|
|
|---|---|---|
| Article Number | A119 | |
| Number of page(s) | 7 | |
| Section | Galactic structure, stellar clusters and populations | |
| DOI | https://doi.org/10.1051/0004-6361/201628070 | |
| Published online | 10 February 2017 | |
Research Note
NGC 5523: An isolated product of soft galaxy mergers?⋆
Department of Astronomy, University of Wisconsin, Madison, WI, 53706, USA
e-mail: lfulmer@wisc.edu
Received: 1 January 2016
Accepted: 3 October 2016
Multi-band images of the very isolated spiral galaxy NGC 5523 show a number of unusual features consistent with NGC 5523 having experienced a significant merger. (1) Near-infrared images from the Spitzer Space Telescope (SST) and the WIYN 3.5-m telescope reveal a nucleated bulge-like structure embedded in a spiral disk; (2) the bulge is offset by ~1.8 kpc from a brightness minimum at the center of the optically bright inner disk; (3) a tidal stream, possibly associated with an ongoing satellite interaction, extends from the nucleated bulge along the disk. We interpret these properties as the results of one or more non-disruptive mergers between NGC 5523 and companion galaxies or satellites, raising the possibility that some galaxies become isolated because they have merged with former companions.
Key words: galaxies: individual: NGC 5523 / galaxies: structure / galaxies: evolution / galaxies: photometry
The reduced images (FITS files) are only available at the CDS via anonymous ftp to cdsarc.u-strasbg.fr (130.79.128.5) or via http://cdsarc.u-strasbg.fr/viz-bin/qcat?J/A+A/598/A119
© ESO, 2017
1. Introduction
NGC 5523 is an apparently normal late-type isolated spiral galaxy (Karachentsev et al. 2011; Minchin et al. 2016) with structural properties indicative of galaxy-galaxy interactions. While isolated galaxies are often considered to evolve with minimal interactions from surrounding galaxies (Jog & Combes 2009), we show that NGC 5523 offers a potential counter-example to this assumption.
Verdes-Montenegro et al. (2005) defined isolated galaxies as those that have not been affected by surrounding objects in the past 3 Gyr. More recently, Karachentsev et al. (2011) shortened this history of interaction, defining isolation as a lack of interaction in the past 1−2 Gyr. By either definition, the structural properties of isolated galaxies are typically assumed to have evolved almost exclusively in their initial formation. Galaxies may be isolated individually or isolated in pairs, triplets, and groups. Of course, in the latter cases, the entire group has not experienced an external influence in the said length of time. In the case of NGC 5523, its nearest neighbor lies more than 1 Mpc away, suggesting that it has not interacted with any of its current neighbors for at least several Gyr. However, its asymmetric internal features imply recent interactions, raising the possibility that it may have become isolated in conjunction with evolutionary processes.
Asymmetries in galaxies can result from a variety of processes, including gas accretion, fly-by interactions, and minor mergers (e.g., Zaritsky & Rix 1997; Bournaud et al. 2005; Mapelli et al. 2008). Furthermore, once formed, asymmetries may persist over Gyr time scales (Zaritsky & Rix 1997; Saha et al. 2007; Lotz et al. 2010). Thus, a disturbed structure in a galaxy can result from processes that occurred sufficiently long ago that obvious remnants, such as the interacting companion, no longer exist.
A detailed study of NGC 5523 has been conducted in which Minchin et al. (2016) conclude that NGC 5523 shows no evidence for recent interactions based on its hydrogen I (HI) line profile. Minchin et al. reach this conclusion by investigating companion candidates near NGC 5523 and ultimately find that no companions exist within 300 kpc of NGC 5523. This result is based on HI data in the Arecibo Galaxy Environment Survey (AGES).
We show that NGC 5523 has properties associated with a historic merger, has experienced a minor interaction in the recent past, and has two dwarf galaxy companions within a 2 Mpc radius. Our study is based on a combination of WIYN H-band imaging, Sloane Digital Sky Survey (SDSS) optical data, and Spitzer Space Telescope (SST) Infrared Array Camera (IRAC) 3.6 μm data. Section 2 describes the observations and data reduction processes that provide the basis for our research. Section 3 details the significant features that lead us to believe that NGC 5523 has participated in past mergers. Section 4 discusses the morphological implications of NGC 5523’s abnormal internal structure. Finally, Sect. 5 offers our conclusions concerning the past of this particular galaxy and what this research could imply for other isolated galaxies.
A general overview of NGC 5523.
2. Observations and data reduction
2.1. Observational data
Our multiwavelength observations include images from Spitzer Space Telescope, Sloane Digital Sky Survey, and WIYN. A sky-subtracted version of the archival near-infrared (NIR) images from SST (IRAC) at 3.6 μm and ~2′′ angular resolution1 (PI: Kartik Sheth, Sky-subtraction: Liese van Zee) were used to capture NGC 5523’s internal structures, including the tidal stream. The combination of SST and SDSS images allow us to identify an offset of ~1.8 kpc between the centers of the optically bright inner disk and the larger outer disk.
The NIR H-band image was obtained on May 24, 2010 using the WIYN High Resolution Infrared Camera (WHIRC) on the WIYN 3.5-m telescope (angular resolution ~0.8′′) located on Kitt Peak2 (PI: Ralph Kotulla). We observed NGC 5523 using a four-point dither pattern with 40′′ steps, repeated twice. A separate sky field, offset by 5′, was observed between the two repeats. Individual exposure times for both object and sky pointings were 100 s per exposure for a total on-source integration time of 800 s. Data reduction followed the WHIRC Data Reduction manual: all exposures were initially corrected for non-linearity using the coefficients in the data reduction guide. Flat-fields were computed from the difference between ten dome-flat exposures with flat-field lamps turned on and off, and corrected for pupil ghost contribution using the published WHIRC pupil ghost template. Each frame was then sky-subtracted using a median-combined stack of all sky-field exposures, and flat-fielded using the aforementioned flat-field. All frames were then distortion-corrected and co-aligned by matching the position of all stars detected in each field, and finally combined into the final stack shown in Fig. 5. Astrometric and photometric calibration was achieved by matching all point sources detected in the stack to a catalog of sources from the Two Micron All-Sky Survery (2MASS) Point Source Catalog (PSC, Skrutskie et al. 2006), providing a matched source catalog of seven stars and yielding absolute astrometric errors of ±0.2′′ and an absolute photometric calibration uncertainty of ~0.15 mag.
2.2. Isophotal modeling and magnitudes
The Space Telescope Science Data Analysis System (STSDAS) modeling task Ellipse was used on the SST 3.6 μm image in order to measure radial light profiles and examine the structure of a possible tidal stream in contrast with the inner disk isophotes. We first performed three individual Ellipse analyses in order to note the changes in the model symmetry depending on the given center point. Table 2 describes the consistent parameters between the three analyses, and Table 3 describes the unique parameters of each analysis with regard to the chosen center point and parameter fixedness. Figure 1 shows the three Ellipse analyses individually overplotted onto a gray-scale image of the input sky-subtracted 3.6 μm SST image.
Consistent input parameters over all Ellipse analyses of NGC 5523.
Variable parameters among Ellipse analyses to account for offset of centers.
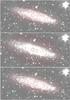 |
Fig. 1 Ellipse models of NGC 5523 overlayed on their original input image, a sky-subtracted version of the archival 3.6 μm SST image. The top-most figure is described as 1a in Table 3, the middle figure as 1b, and the bottom-most figure as 1c. All parts are rotated clockwise 45° as compared to Fig. 2a. |
Following these analyses, we used the resulting models to create radial light profiles of NGC 5523. Figure 3 contains the light profile of Fig. 1c, which most obviously displays the offset of centers between the inner and outer disks, represented as an asymmetry in Ellipse. This offset of centers is discussed in more detail in Sect. 3.3.
The task Apphot was then used to determine physical properties of the tidal stream and the nucleated bulge, such as luminosity and mass, from the 3.6 μm image obtained with SST (Table 4). With these mass calculations, we could then determine with more accuracy the influence of such a massive object on NGC 5523’s evolution. Individual features of NGC 5523 are detailed in Sect. 3.
A photometric evaluation of stellar masses for the significant features of NGC 5523.
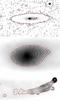 |
Fig. 2 Contour levels used for the Apphot analyses of the Galaxy Total (top, 2a), Nucleated Bulge (middle, 2b), and Visible Tidal Stream (bottom, 2c) as described in Table 4. All contours were based on a sky-subtracted version of the archival 3.6 μm SST image. For each analysis, the outermost contour (drawn in red) was taken as the sky value, thus Apphot considered all light within each exhibited contour in the photometric analysis. The physical dimensions of the topmost image (2a) are 44.7 kpc × 30.4 kpc. |
3. Analysis of significant features
3.1. The regular, blue outer disk
The outer disk of NGC 5523 displays a highly symmetrical HI line profile and extremely regular structure Haynes et al. (2011). As seen in Fig. 3, there are no significant perturbations in the outer disk, giving a smoothly exponential curve in the latter half of the plot.
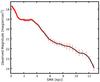 |
Fig. 3 Observed 3.6 μm magnitude vs. semi-major axis (SMA) for the inner and outer disks of NGC 5523, from the Ellipse analysis displayed in Fig. 1c. In this plot, SMA = 0 is located at the center of the brightness minimum, and thus the plateau beginning at ~1.8 kpc denotes the presence of the nucleated bulge. Outside the inner disk (starting ~6 kpc), the slope of the outer disk photometry is ~0.34 |

Furthermore, a color analysis of SDSS images of NGC 5523 reveals that the outer disk is relatively blue compared to the nucleated bulge and inner disk (Fig. 4). The color analysis was performed by first obtaining Ellipse fits for g and r SDSS images. In running the Ellipse fits, the SDSS nano-maggy calibration was used to convert to SDSS AB magnitudes. Colors were calculated as the difference between the g and r AB magnitudes from their respective Ellipse fits.
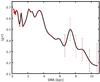 |
Fig. 4 Color analysis of NGC 5523 from SDSS (g−r) images. Color errors for the inner disk are less than 0.1 (not shown). Error maximizes at 0.2 at the outermost isophote, dominated by systematic background errors. All error measurements are approximate due to uncertainties in the background subtraction. |
3.2. The bulge and nucleus
Using WHIRC on the WIYN telescope, we can clearly observe the internal structure of the nucleated bulge, the likely dynamical center of the system (Walcher et al. 2005). As shown in Figs. 2 and 5, the bulge, which produces ~1% of the 3.6 μm luminosity in NGC 5523 (Table 4), contains a concentrated nuclear feature centered within a significant bulge. This dynamically relaxed structure with the red colors of an old stellar population further suggests that the bulge has long been present and prominent in the host galaxy of this system. The slightly rectangular isophotes surrounding the nucleated bulge in Fig. 2 may also be evidence for a bar in the nucleated bulge.
We obtained photometry of the semi-stellar nucleus in NGC 5523 from the H-band WHIRC data. We did not fully resolve the nucleus, but the radial intensity distribution is somewhat broader than that of nearby stars (FWHM seeing of ~0.8−0.9′′). Instrumental magnitudes were calculated with the IRAF Apphot task for several circular apertures. Using the magnitude growth curves for stars we adopted results for the nucleus from a seven-pixel radius (1.4′′ diameter) aperture. The absolute calibration was obtained by matching the H = 10.60 mag listed in NED from a 51.8′′ diameter aperture on NGC 5523, which gives H = 15.8 for the nucleus. For D = 20.6 Mpc the nucleus has, coincidentally, MH ≈ −15.8. Thus the nuclear complex of NGC 5523 appears to be relatively normal when compared to other spirals (e.g., Frogel 1985; Hughes et al. 2005).
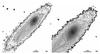 |
Fig. 5 a) WHIRC H band image from the WIYN 3.5-m telescope, shown in a log scale. WIYN’s 0.8′′ resolution allows us to examine the internal structure of the nucleated bulge, offering a level of detail unavailable in IRAC images. b) The same image with added contours that detail the internal structure of the nucleated bulge. This image also features the brightness minimum in the lower left-hand corner, clearly denoting the offset between the two extrema. Both parts are rotated counter-clockwise 135° as compared to Fig. 2a. |
3.3. The offset of centers
Our surface photometry shows that NGC 5523 consists of two distinct disks: the optically bright inner disk with an intensity minimum at its center and the structurally regular outer disk with the nucleated bulge at its center. These disks, while concentric in typical galaxies, are displaced in NGC 5523. Table 5 gives quantitative evidence for this offset, supplemented with Fig. 6. Figure 6 also displays isophotal definitions of the inner and outer disks. As shown in Table 5, the brightness minimum and the nucleated bulge (brightness maximum) are each associated with distinct physical centers, similar to the effects observed in interacting galaxies (Schweizer 1996; Jog & Maybhate 2006). However, asymmetric galaxies are also found in low density environments with no direct indications for recent interactions (e.g., Matthews & Gallagher 1997; Matthews & Gallagher 2002).
A quantitative spatial analysis of the offset of centers of NGC 5523.
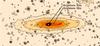 |
Fig. 6 Spitzer IRAC image of NGC 5523 at 3.6 μm, displayed in a log scale. Figure 6 functions as a reference for distance measurements in Table 5. Points A and B denote the apsides of the outer disk, and similarly points C and D denote those of the inner disk. The Brightness Maximum indicates the center of the nucleated bulge and the Brightness Minimum describes the isophotal center of NGC 5523. The major axis runs east-west with east at the right edge of the image and north at the bottom edge. |
3.4. The tidal stream
We find an asymmetric feature shown in Fig. 5 (see also Figs. 2a,c) that originates from the nucleated bulge (possibly the associated satellite galaxy) and extends throughout the entire inner disk with an irregular luminosity gradient. This type of structure is usually associated with a tidal stream resulting from the disruption of a dwarf satellite galaxy (e.g., Johnston et al. 1999; Peñarrubia et al. 2006; Martínez-Delgado et al. 2010).
Figure 5a (see also Fig. 6) effectively displays the prominence of the tidal stream, and Table 4 gives a photometric analysis of the visible tidal stream. The photometry in Table 4 suggests that the tidal stream is associated with an interacting dwarf satellite galaxy with M∗ ≥ 107M⊙. The IRAC image shows a bright source at the head of the stream. This feature is not detected in the WIYN H-band image. Therefore, although its nature is uncertain, we can deduce that this feature has very red colors.
3.5. Neighboring galaxies
Utilizing NED, we find that NGC 5523 has two notable dwarf galaxy neighbors, as described in Tables 6 and 7. It is unlikely that these companions are gravitationally bound to NGC 5523, making NGC 5523 an at-large member of a loose cloud of galaxies. The presence of these moderately luminous, albeit distant companions suggests that deeper surveys for additional neighboring low-mass galaxies could provide insights into the evolution of NGC 5523.
A summary of the two dwarf galaxy companions of NGC 5523.
Magnitude and luminosity comparisons of NGC 5523 and its dwarf galaxy companions.
4. Discussion
NGC 5523 is a globally isolated galaxy (Karachentsev et al. 2011; Minchin et al. 2016) in which we find possible evidence for past interactions with neighboring galaxies. This observation contradicts the simplifying assumption that isolated galaxies form and evolve with minimal interactions from other galaxies (Kapferer et al. 2005). Our measurements of the structure of NGC 5523 in combination with results from numerical models (Bournaud et al. 2005; Mapelli et al. 2008; Pardy et al. 2016) lead us to believe that some galaxies that were once part of binary systems or small groups become isolated by way of one or even several minor mergers. This evolutionary path would be consistent with the observed presence of small galaxy groups even in voids where the overall density of galaxies is low (Kreckel et al. 2011).
While asymmetric galaxy structures can result from a variety of processes (gas accretion, fly-by interactions, etc.), we favor a past interaction as the source of the asymmetry in NGC 5523 (Jog & Maybhate 2008; de Swardt et al. 2015). Gas accretion, for example, is expected to have a larger effect on the HI disk than on the stellar body. The HI spectrum of NGC 5523, however, is highly symmetric, consistent with a relaxed outer HI disk (Matthews et al. 1998). Alternatively, while fly-by interactions can occur even in low density environments (e.g., Kreckel et al. 2011), the known companions of NGC 5523 have projected separations of >1 Mpc and are unlikely to have made fly-bys past NGC 5523 given their relative velocities (Table 6). We therefore favor a past merger as the perturbation that produced a long-lived asymmetry in NGC 5523 (Saha et al. 2007), an event that could also be associated with the production of its prominent bulge (Bournaud et al. 2005).
We infer that the nucleated bulge, the probable current dynamical center of the system, has always been the dynamical center of the primary host galaxy. There was likely a past perturbation that caused the entire inner disk to shift in comparison to this dynamical center, thus creating an offset (e.g., Matthews & Gallagher 2002; Bournaud et al. 2005). This perturbation could have been caused by the object that is now the tidal stream if it were sufficiently massive, or more likely by an object that has been assimilated into the galaxy. Following this prediction, the brightness minimum is a direct result of the inner disk shifting and drawing away from the nucleated bulge. It does not represent the true center of the primary host galaxy, even though it is currently the isophotal center of the inner disk.
Such a significant perturbation throughout the inner disk of NGC 5523 could be explained by one of two scenarios. Both cases are interpreted in the context of the Pardy et al. (2016) simulations of galaxy interactions which are consistent with other models in showing that mergers and interactions can lead to non-axisymmetric galaxy structures (e.g., Bournaud et al. 2005; Jog & Maybhate 2006). In the first scenario, a companion body of roughly 10% the mass of the primary galaxy merged with and has already been assimilated into the host galaxy. In this case, there is no direct evidence of the companion body, and the tidal stream is a remnant from a second non-disruptive satellite merger that occurred in the more-recent past.
Alternatively, the tidal stream is the remnant of the initial significant merger that caused the inner disk to shift. The tidal stream, as currently observed, is far too small to have created such an impact on the host galaxy, having a mass of only ~0.1% of its host. Thus, in order for the object that is now the tidal stream to cause such a disturbance, it would have to have infiltrated the host galaxy along the direction of rotation or pass completely through the plane of the galaxy. We support the former scenario, that the object was assimilated along the direction of rotation, because the tidal stream is currently crossing the plane of the inner disk. In general, the presence of the tidal stream as a merging body within NGC 5523 suggests the presence of multiple dwarf satellites surrounding NGC 5523.
The highly regular outer disk of NGC 5523 offers insight into the timescale of this soft interaction. Given that a galaxy’s structure will return to homogeny over time (Zaritsky & Rix 1997; Saha et al. 2007; Lotz et al. 2010), the extreme regularity and symmetry of the outer disk suggests that any mergers that NGC 5523 experienced occurred in the distant (≥ few Gyr) past. Therefore, the disturbance must have been mild enough to maintain the integrity of the primary host galaxy (Hopkins et al. 2009). We describe this type of interaction as a soft merger.
5. Conclusion
Our study of the evolution of the isolated galaxy NGC 5523 offers a counter example to simple assumptions about isolated galaxy evolution. The extreme isolation of NGC 5523 suggests that past mergers did not influence its evolution. However, its symmetric HI outer disk in combination with its asymmetric inner structure gives significant evidence for a past merger. Furthermore, the tidal stream, likely a remnant from an interaction with a bound dwarf companion, indicates a more-recent merger. We conclude that the asymmetric internal structure of NGC 5523 is the product of one or more past minor mergers with surrounding low-mass galaxies.
We reach this conclusion based on the observed structural effects of interactions in NGC 5523 in combination with the ≥Gyr timescales necessary for these effects to rehomogenize among the galaxy. Evidence for such interactions includes the offset between the inner/outer disks, the prominence of the tidal stream, and the properties of the nucleated bulge. NGC 5523’s complex inner structure in combination with its global isolation and homogenous outer structure have most likely been produced by mergers with its nearest neighbors: a process of isolation by annexation.
Data Set ID: wiyn.whirc.20100525T082757
Acknowledgments
We would like to thank the staff of the WIYN Observatory for their assistance in obtaining the images in this study. We thank Zishan Xia for early discussions and and Elena D’Onghia and Stephen Pardy for sharing their results on interacting galaxies prior to publication. Ralf Kotulla gratefully acknowledges financial support from the National Science Foundation under Grant No. AST-1412449. We would like to thank the entire AGES survey team for their contributions towards observing, data processing and analysis. This research has made use of the NASA/IPAC Extragalactic Database (NED) which is operated by the Jet Propulsion Laboratory, California Institute of Technology, under contract with the National Aeronautics and Space Administration. STSDAS is a product of the Space Telescope Science Institute, which is operated by AURA for NASA. Funding for the Sloan Digital Sky Survey IV was provided by the Alfred P. Sloan Foundation, the US Department of Energy Office of Science, and the Participating Institutions. SDSS-IV acknowledges support and resources from the Center for High-Performance Computing at the University of Utah. The SDSS web site is www.sdss.org.
SDSS-IV is managed by the Astrophysical Research Consortium for the Participating Institutions of the SDSS Collaboration including the Brazilian Participation Group, the Carnegie Institution for Science, Carnegie Mellon University, the Chilean Participation Group, the French Participation Group, Harvard-Smithsonian Center for Astrophysics, Instituto de Astrofísica de Canarias, The Johns Hopkins University, Kavli Institute for the Physics and Mathematics of the Universe (IPMU)/University of Tokyo, Lawrence Berkeley National Laboratory, Leibniz Institut für Astrophysik Potsdam (AIP), Max-Planck-Institut für Astronomie (MPIA Heidelberg), Max-Planck-Institut für Astrophysik (MPA Garching), Max-Planck-Institut für Extraterrestrische Physik (MPE), National Astronomical Observatory of China, New Mexico State University, New York University, University of Notre Dame, Observatário Nacional/MCTI. The Ohio State University, Pennsylvania State University, Shanghai Astronomical Observatory, United Kingdom Participation Group, Universidad Nacional Autónoma de México, University of Arizona, University of Colorado Boulder, University of Oxford, University of Portsmouth, University of Utah, University of Virginia, University of Washington, University of Wisconsin, Vanderbilt University, and Yale University.
References
- Bournaud, F., Jog, C. J., & Combes, F. 2005, A&A, 437, 69 [NASA ADS] [CrossRef] [EDP Sciences] [Google Scholar]
- de Swardt, B., Sheth, K., Kim, T., et al. 2015, ApJ, 808, 90 [NASA ADS] [CrossRef] [Google Scholar]
- Frogel, J. A. 1985, ApJ, 298, 528 [NASA ADS] [CrossRef] [Google Scholar]
- Haynes, M. P., Giovanelli, R., Martin, A. M., et al. 2011, AJ, 142, 170 [NASA ADS] [CrossRef] [Google Scholar]
- Hopkins, P. F., Cox, T. J., Younger, J. D., & Hernquist, L. 2009, ApJ, 691, 1168 [Google Scholar]
- Hughes, M. A., Axon, D., Atkinson, J., et al. 2005, AJ, 130, 73 [NASA ADS] [CrossRef] [Google Scholar]
- Jog, C. J., & Combes, F. 2009, ApJ, 471, 75 [Google Scholar]
- Jog, C. J., & Maybhate, A. 2006, MNRAS, 370, 891 [NASA ADS] [Google Scholar]
- Jog, C. J., & Maybhate, A. 2008, IAU Symp., 245, 79 [NASA ADS] [Google Scholar]
- Johnston, K. V., Zhao, HongSheng, Spergel, D. N., & Hernquist, L. 1999, ApJ, 512, L109 [NASA ADS] [CrossRef] [Google Scholar]
- Kapferer, W., Knapp, A., Schindler, S., Kimeswenger, S., & van Kampen, E. 2005, A&A, 438, 87 [NASA ADS] [CrossRef] [EDP Sciences] [Google Scholar]
- Karachentsev, I. D., Makarov, D. I., Karachentseva, V. E., & Melnyk, O. V. 2011, AB, 66, 1 [Google Scholar]
- Kreckel, K., Platen, E., Aragòn-Calvo, M. A., et al. 2011, AJ, 141, 4 [NASA ADS] [CrossRef] [Google Scholar]
- Lotz, J. M., et al. 2010, MNRAS, 404, 590 [NASA ADS] [CrossRef] [Google Scholar]
- Mapelli, M., Moore, B., & Bland-Hawthorn, J. 2008, MNRAS, 388, 697 [NASA ADS] [CrossRef] [Google Scholar]
- Martínez-Delgado, D., Gabany, R. J., Crawford, K., et al. 2010, AJ, 140, 962 [NASA ADS] [CrossRef] [Google Scholar]
- Matthews, L. D., & Gallagher, J. S., III 1997, AJ, 114, 1899 [NASA ADS] [CrossRef] [Google Scholar]
- Matthews, L. D., & Gallagher, J. S., III 2002, ApJ, 141, 429 [Google Scholar]
- Matthews, L. D., van Driel, W., & Gallagher, J. S., III 1998, AJ, 116, 1169 [NASA ADS] [CrossRef] [Google Scholar]
- Minchin, R. F., Auld, R., Davies, J. I., et al. 2016, MNRAS, 455, 3430 [NASA ADS] [CrossRef] [Google Scholar]
- Pardy, S. A., D’Onghia, E., Athanassoula, E., Wilcots, E. M., & Sheth, K. 2016, ApJ, 827, 149 [NASA ADS] [CrossRef] [Google Scholar]
- Peñarrubia, J., McConnachie, A., Babul, A., et al. 2006, ApJ, 650, 33 [Google Scholar]
- Saha, K., Combes, F., & Jog, C. J. 2007, MNRAS, 382, 419 [NASA ADS] [CrossRef] [Google Scholar]
- Schweizer, F. 1996, AJ, 111, 109 [NASA ADS] [CrossRef] [Google Scholar]
- Skrutskie, M. F., Cutri, R. M., Stiening, R., et al. 2006, AJ, 131, 1163 [NASA ADS] [CrossRef] [Google Scholar]
- Verdes-Montenegro, L. 2005, A&A, 436, 443 [NASA ADS] [CrossRef] [EDP Sciences] [Google Scholar]
- Walcher, C. J., van der Marel, R. P., McLaughlin, D., et al. 2005, ApJ, 618, 237 [NASA ADS] [CrossRef] [Google Scholar]
- Zaritsky, D., & Rix, H.-W. 1997, ApJ, 477, 118 [NASA ADS] [CrossRef] [Google Scholar]
All Tables
A photometric evaluation of stellar masses for the significant features of NGC 5523.
Magnitude and luminosity comparisons of NGC 5523 and its dwarf galaxy companions.
All Figures
|
Fig. 1 Ellipse models of NGC 5523 overlayed on their original input image, a sky-subtracted version of the archival 3.6 μm SST image. The top-most figure is described as 1a in Table 3, the middle figure as 1b, and the bottom-most figure as 1c. All parts are rotated clockwise 45° as compared to Fig. 2a. |
| In the text | |
|
Fig. 2 Contour levels used for the Apphot analyses of the Galaxy Total (top, 2a), Nucleated Bulge (middle, 2b), and Visible Tidal Stream (bottom, 2c) as described in Table 4. All contours were based on a sky-subtracted version of the archival 3.6 μm SST image. For each analysis, the outermost contour (drawn in red) was taken as the sky value, thus Apphot considered all light within each exhibited contour in the photometric analysis. The physical dimensions of the topmost image (2a) are 44.7 kpc × 30.4 kpc. |
| In the text | |
|
Fig. 3 Observed 3.6 μm magnitude vs. semi-major axis (SMA) for the inner and outer disks of NGC 5523, from the Ellipse analysis displayed in Fig. 1c. In this plot, SMA = 0 is located at the center of the brightness minimum, and thus the plateau beginning at ~1.8 kpc denotes the presence of the nucleated bulge. Outside the inner disk (starting ~6 kpc), the slope of the outer disk photometry is ~0.34 |
| In the text | |
|
Fig. 4 Color analysis of NGC 5523 from SDSS (g−r) images. Color errors for the inner disk are less than 0.1 (not shown). Error maximizes at 0.2 at the outermost isophote, dominated by systematic background errors. All error measurements are approximate due to uncertainties in the background subtraction. |
| In the text | |
|
Fig. 5 a) WHIRC H band image from the WIYN 3.5-m telescope, shown in a log scale. WIYN’s 0.8′′ resolution allows us to examine the internal structure of the nucleated bulge, offering a level of detail unavailable in IRAC images. b) The same image with added contours that detail the internal structure of the nucleated bulge. This image also features the brightness minimum in the lower left-hand corner, clearly denoting the offset between the two extrema. Both parts are rotated counter-clockwise 135° as compared to Fig. 2a. |
| In the text | |
|
Fig. 6 Spitzer IRAC image of NGC 5523 at 3.6 μm, displayed in a log scale. Figure 6 functions as a reference for distance measurements in Table 5. Points A and B denote the apsides of the outer disk, and similarly points C and D denote those of the inner disk. The Brightness Maximum indicates the center of the nucleated bulge and the Brightness Minimum describes the isophotal center of NGC 5523. The major axis runs east-west with east at the right edge of the image and north at the bottom edge. |
| In the text | |
Current usage metrics show cumulative count of Article Views (full-text article views including HTML views, PDF and ePub downloads, according to the available data) and Abstracts Views on Vision4Press platform.
Data correspond to usage on the plateform after 2015. The current usage metrics is available 48-96 hours after online publication and is updated daily on week days.
Initial download of the metrics may take a while.