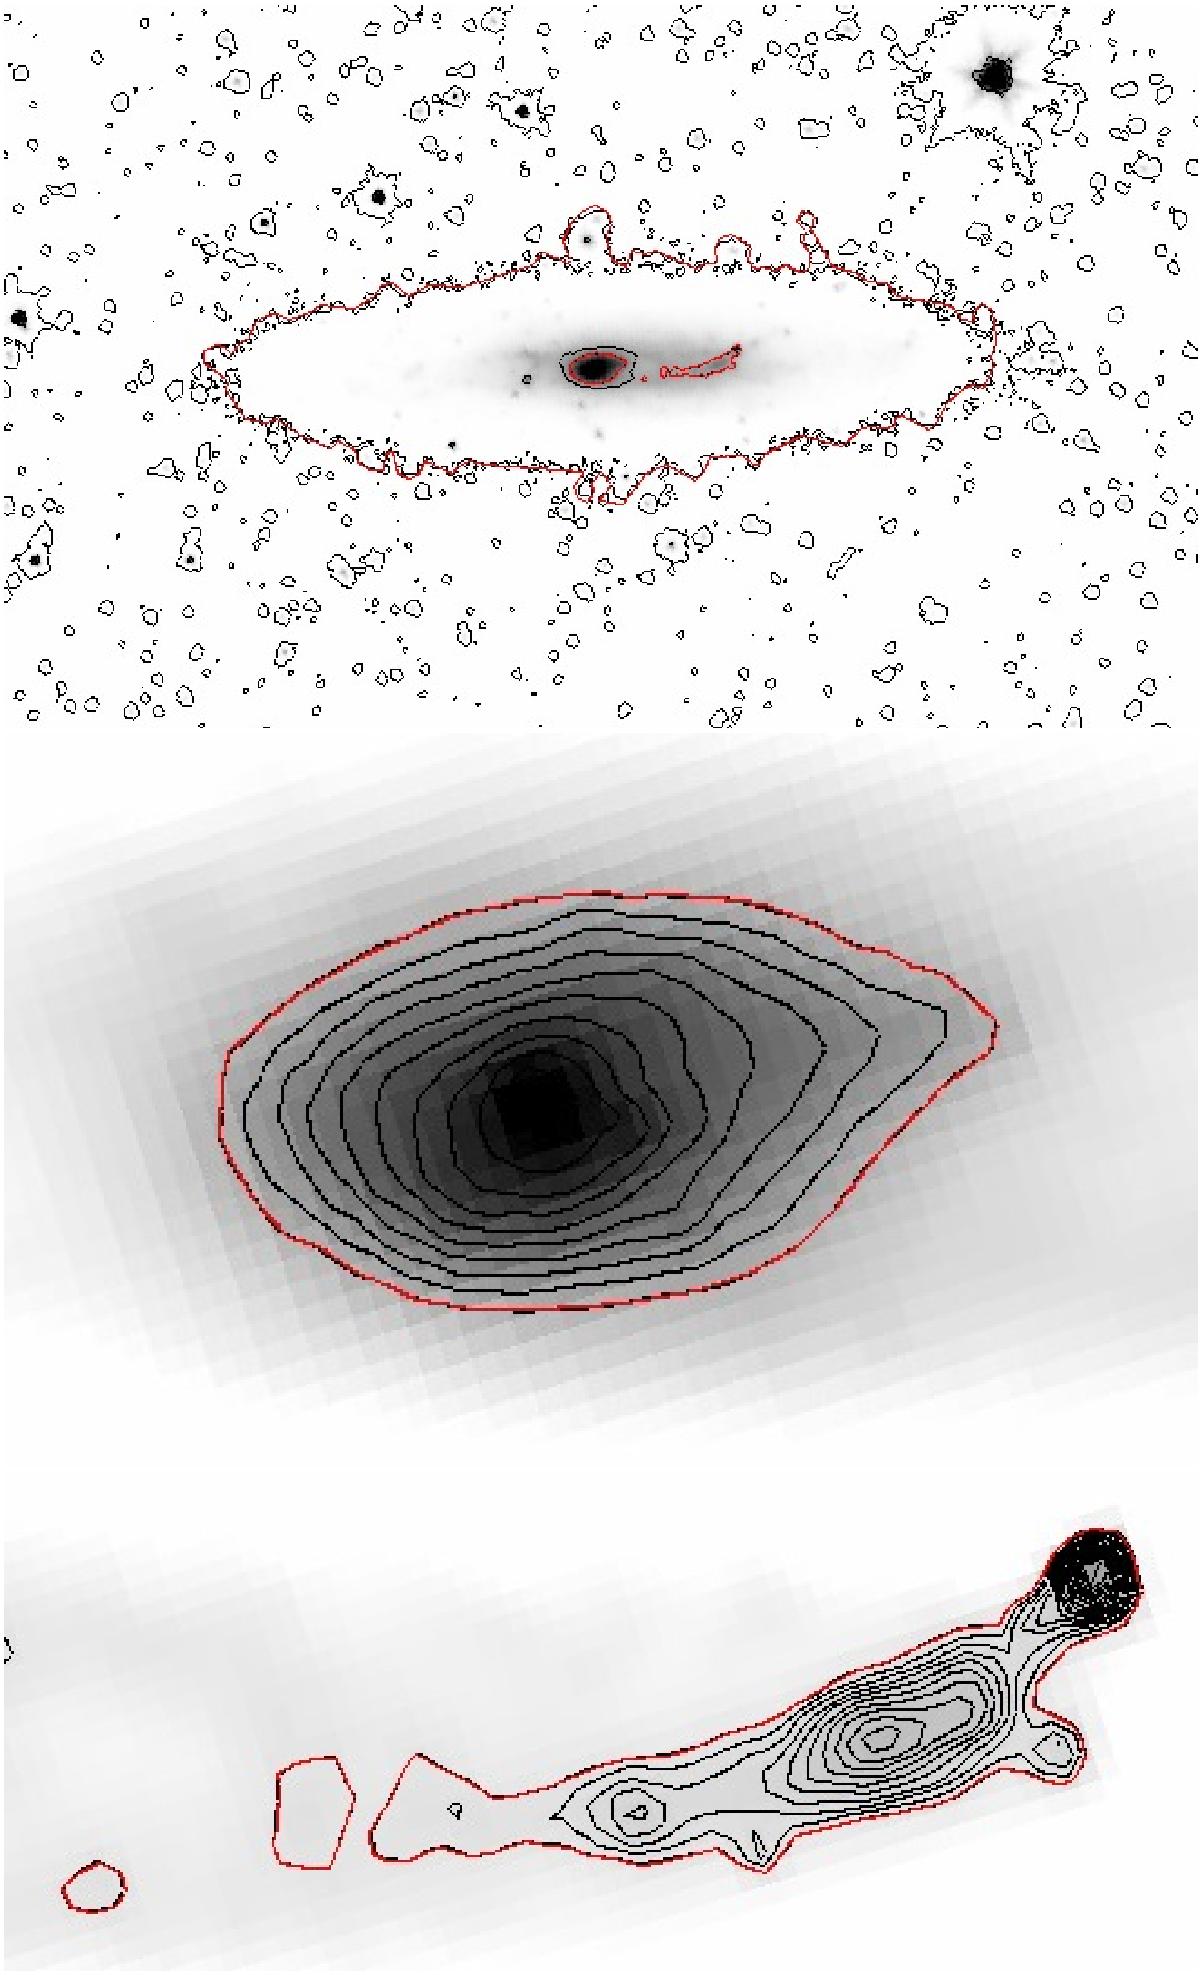
Fig. 2

Contour levels used for the Apphot analyses of the Galaxy Total (top, 2a), Nucleated Bulge (middle, 2b), and Visible Tidal Stream (bottom, 2c) as described in Table 4. All contours were based on a sky-subtracted version of the archival 3.6 μm SST image. For each analysis, the outermost contour (drawn in red) was taken as the sky value, thus Apphot considered all light within each exhibited contour in the photometric analysis. The physical dimensions of the topmost image (2a) are 44.7 kpc × 30.4 kpc.
Current usage metrics show cumulative count of Article Views (full-text article views including HTML views, PDF and ePub downloads, according to the available data) and Abstracts Views on Vision4Press platform.
Data correspond to usage on the plateform after 2015. The current usage metrics is available 48-96 hours after online publication and is updated daily on week days.
Initial download of the metrics may take a while.


