Fig. 6
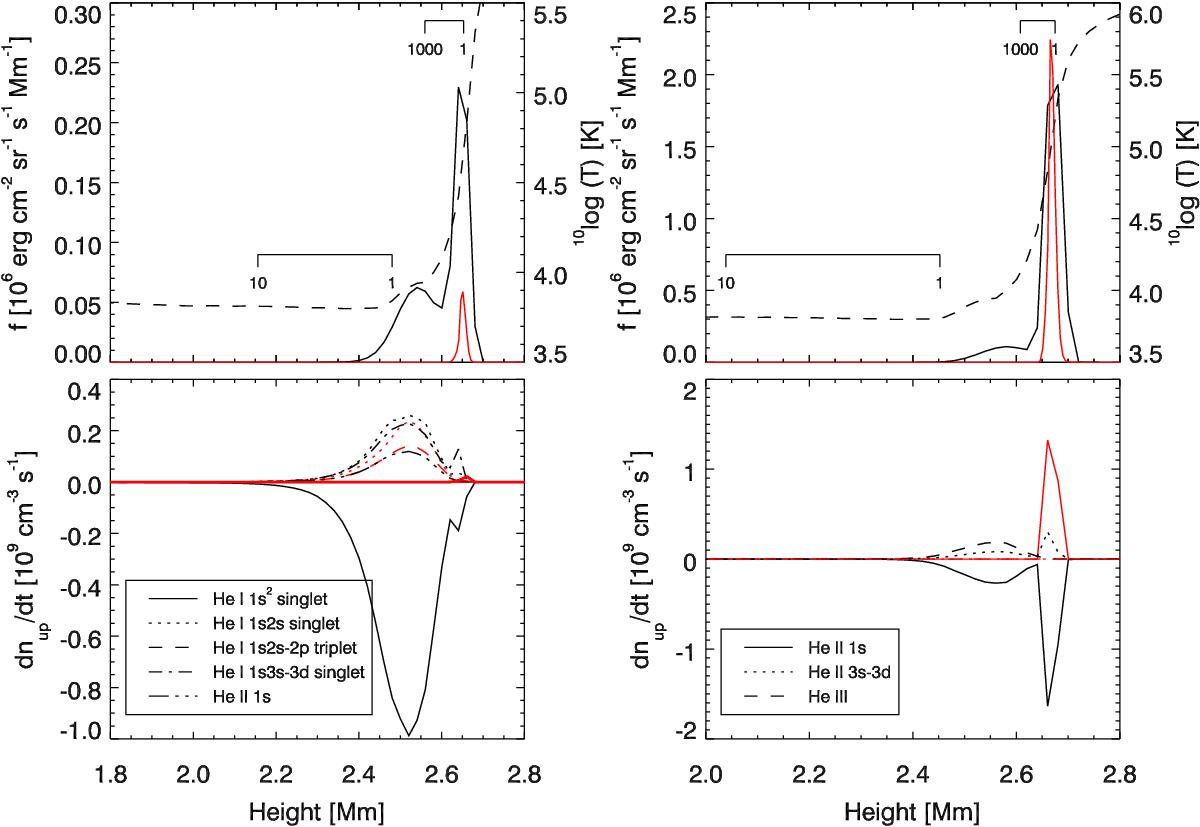
Comparison of the NE-NLTE thick and non-equilibrium thin line formation of He i λ584 (left column) and He ii λ304 (right column). Upper panels: contribution functions (scale to the left) for thick formation (solid black) and thin formation (solid red). For context the temperature is also shown (dashed curve, scale to the right). Two additional scales are drawn in each of the two upper panels. The upper scale shows the optical depth at line center. The lower scale shows the optical depth for the continuum. Bottom panels: net rates into the upper level of the transition. Collisional processes are indicated by red lines and radiative transitions are indicated by black lines.
Current usage metrics show cumulative count of Article Views (full-text article views including HTML views, PDF and ePub downloads, according to the available data) and Abstracts Views on Vision4Press platform.
Data correspond to usage on the plateform after 2015. The current usage metrics is available 48-96 hours after online publication and is updated daily on week days.
Initial download of the metrics may take a while.