Fig. 5
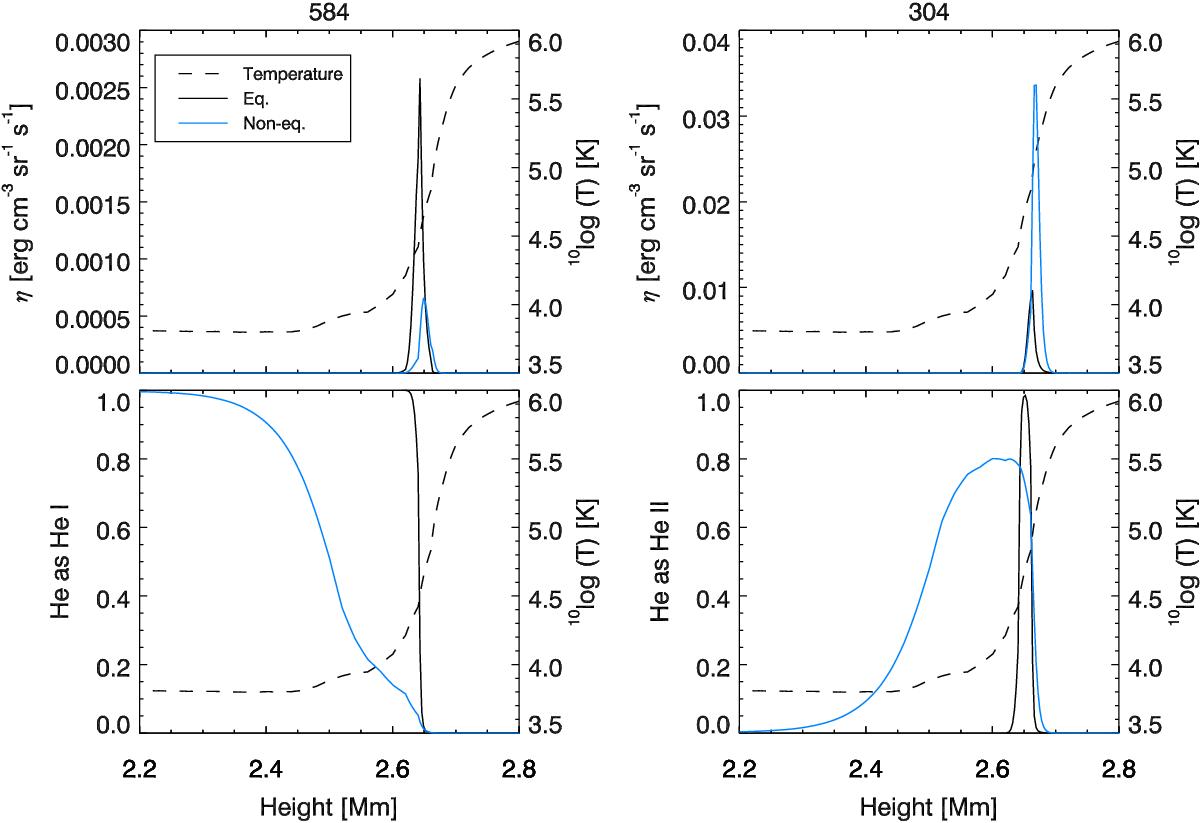
Details of the thin line formation of He i λ584 (left column) and He ii λ304 (right column). Upper panels: line emissivities (solid, scale to the left) and temperature (dashed, scale to the right). Bottom panels: ion fractions (solid, scale to the left) and temperature (dashed, scale to the right). The black lines show the values corresponding to ionisation equilibrium and the blue lines show the values corresponding to non-equilibrium ionisation.
Current usage metrics show cumulative count of Article Views (full-text article views including HTML views, PDF and ePub downloads, according to the available data) and Abstracts Views on Vision4Press platform.
Data correspond to usage on the plateform after 2015. The current usage metrics is available 48-96 hours after online publication and is updated daily on week days.
Initial download of the metrics may take a while.