Fig. 1
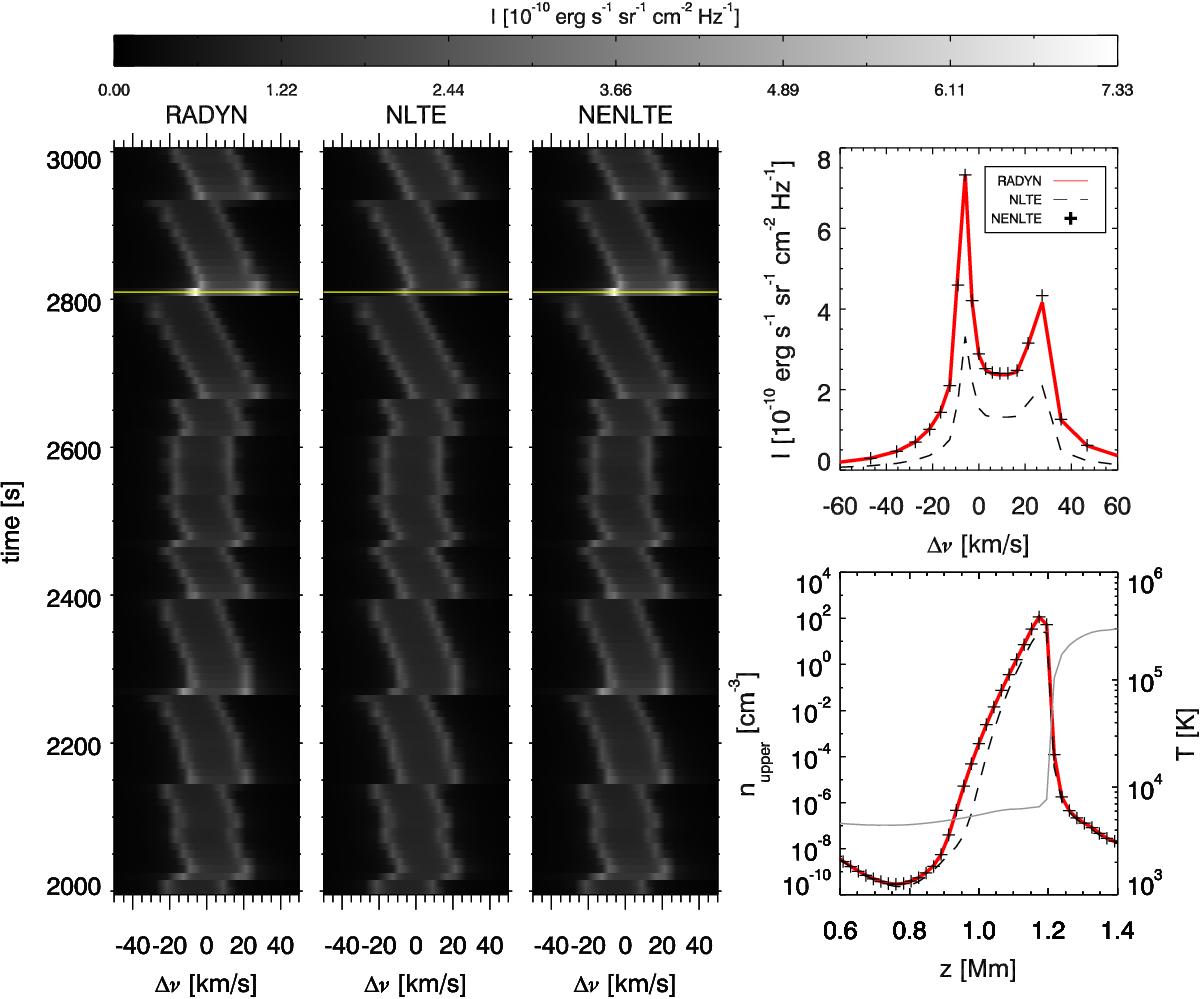
Emergent He iλ584 line profiles from the Radyn simulation compared to the NLTE and NE-NLTE radiative transfer solutions from Multi (three left panels). The top right panel shows the line profile in the three approaches for the snapshot indicated by the yellow lines. The bottom right panel shows the number density of the upper level of the transition in the three approaches. The grey line shows the temperature with scale to the right.
Current usage metrics show cumulative count of Article Views (full-text article views including HTML views, PDF and ePub downloads, according to the available data) and Abstracts Views on Vision4Press platform.
Data correspond to usage on the plateform after 2015. The current usage metrics is available 48-96 hours after online publication and is updated daily on week days.
Initial download of the metrics may take a while.