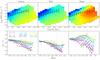
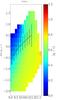
Fig. 9

Galaxy (left panels), disc (central panels), and bulge (right panels) colours in the Log SFR – Log M⋆ plane. In the upper panels, the distribution of galaxies in the Log SFR – Log M⋆ plane is colour-coded according to the weighted average (g−r) colour in each bin. The bins are 0.2 M⊙ in Log M⋆ and 0.2 M⊙ yr-1 in Log SFR. In the bottom panels, the (g−r) colour is shown as a function of the distance from the MS, ΔMS, in different bins of stellar mass, represented by different colours (same as Fig. 5). The error bars in the lower panels are obtained via a bootstrapping.
Current usage metrics show cumulative count of Article Views (full-text article views including HTML views, PDF and ePub downloads, according to the available data) and Abstracts Views on Vision4Press platform.
Data correspond to usage on the plateform after 2015. The current usage metrics is available 48-96 hours after online publication and is updated daily on week days.
Initial download of the metrics may take a while.