Fig. 5
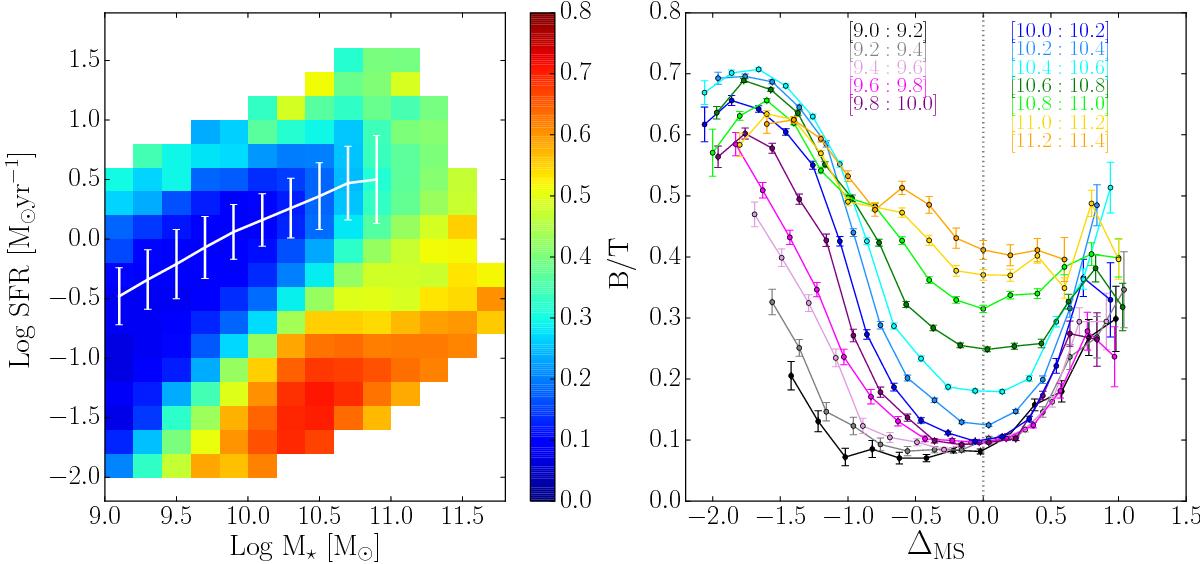
Left panel: Log SFR – Log M⋆ plane colour-coded according to the weighted average B/T in the bin. The white line represents the location of the MS of SFGs, and the error bars indicate its dispersion. Right panel: B/T ratio as a function of ΔMS (distance from the MS) in different stellar mass bins. The dotted vertical line indicate the position of the MS. Error bars are obtained via bootstrapping.
Current usage metrics show cumulative count of Article Views (full-text article views including HTML views, PDF and ePub downloads, according to the available data) and Abstracts Views on Vision4Press platform.
Data correspond to usage on the plateform after 2015. The current usage metrics is available 48-96 hours after online publication and is updated daily on week days.
Initial download of the metrics may take a while.