Fig. 5
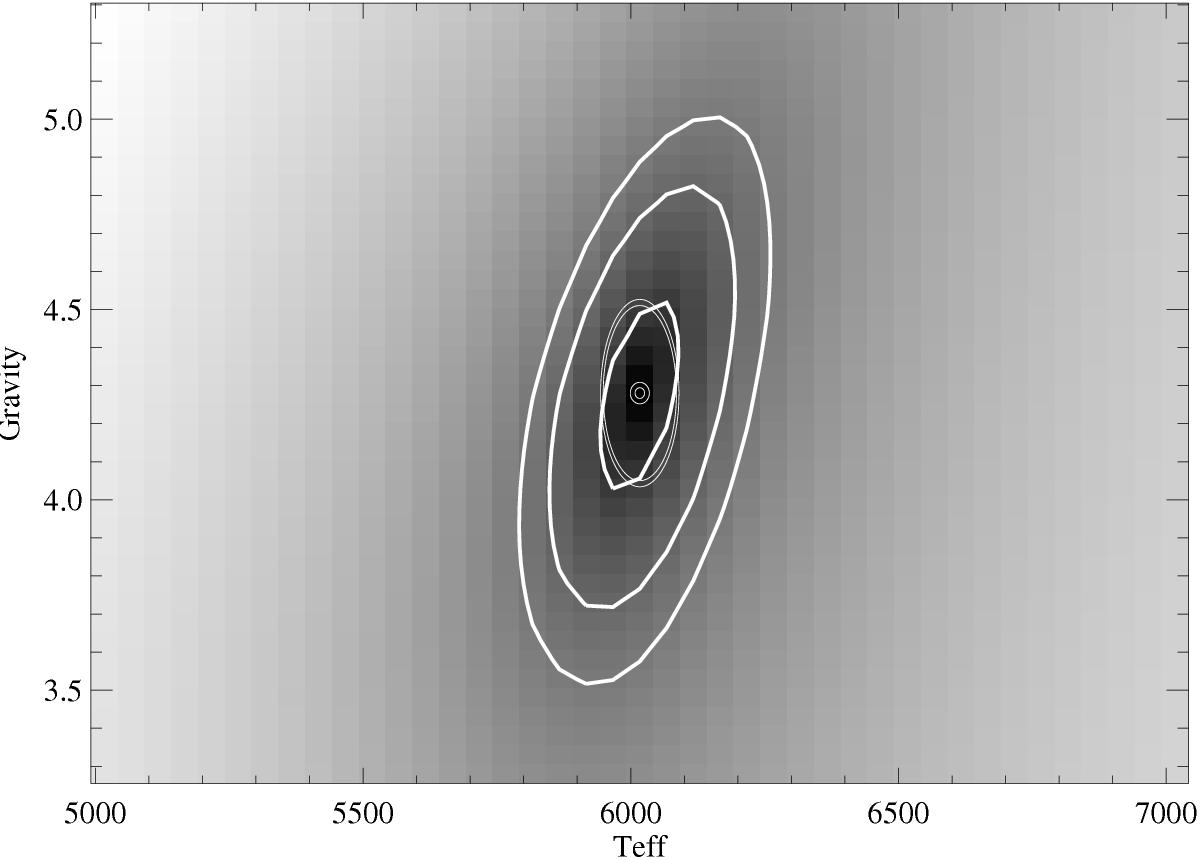
Slice of the χ2 space along the Teff-log g plane for the example presented in Fig. 4. Contours show 1, 2 and 3σ levels above the minimum determined with procedure described in Sect. 5. The double circle in the center shows the uncertainties given by the main diagonal elements of the covariance matrix constructed by SME at the end of iterations. A larger double ellipse comes from the new uncertainty estimate.
Current usage metrics show cumulative count of Article Views (full-text article views including HTML views, PDF and ePub downloads, according to the available data) and Abstracts Views on Vision4Press platform.
Data correspond to usage on the plateform after 2015. The current usage metrics is available 48-96 hours after online publication and is updated daily on week days.
Initial download of the metrics may take a while.