Fig. 6
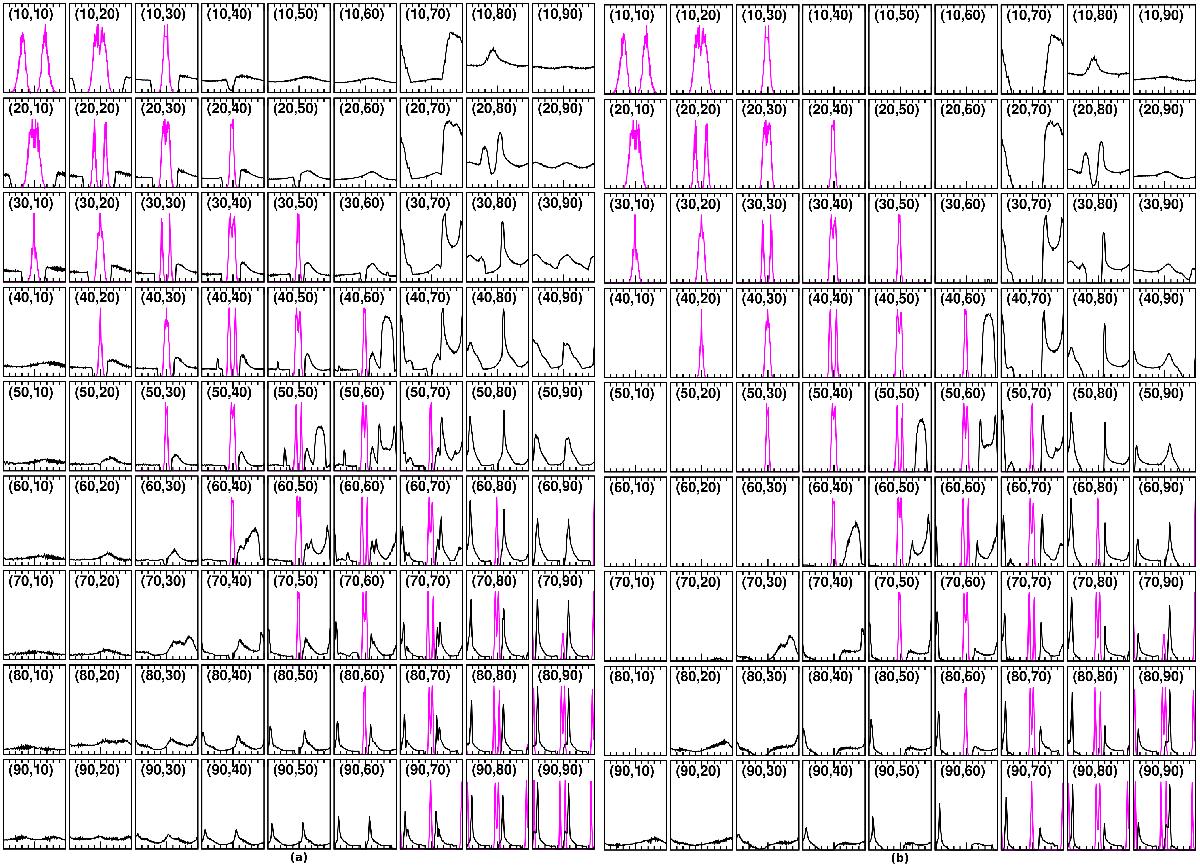
Plot of predicted TPC (panel a)) and OG (panel b)) γ-ray (black) and radio (magenta) light curves on a (α,ζPSR) grid. The γ-ray intensity has been normalized globally so that the maximum (typically at α = ζPSR = 90°) is unity and the flux of the other combinations of α and ζPSR relative to this maximum is clear. The x-axis denotes normalized from –0.5 to 0.5. A phase offset of 0.5 has been artificially imposed to centre the radio pulses for visual clarity. The coordinate pair in each panel refers to the value of α and ζPSR in each case.
Current usage metrics show cumulative count of Article Views (full-text article views including HTML views, PDF and ePub downloads, according to the available data) and Abstracts Views on Vision4Press platform.
Data correspond to usage on the plateform after 2015. The current usage metrics is available 48-96 hours after online publication and is updated daily on week days.
Initial download of the metrics may take a while.