Fig. 5
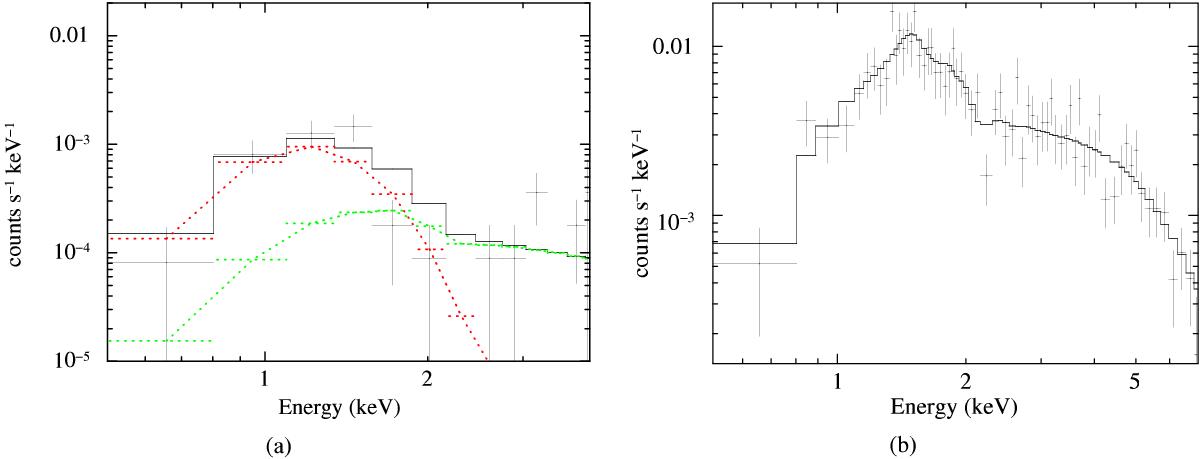
ACIS-S spectra for the X-ray counterpart of the pulsar (panel a)) and the entire PWN (panel b)). The solid lines correspond to the respective best-fit spectral models (absorbed blackbody and absorbed power law, respectively). In the panel a), the pulsar blackbody component (red) and the nebular contribution in the same region (green) are shown. The unbinned spectrum fitted using C-statistics has been rebinned in the plot for visual clarity.
Current usage metrics show cumulative count of Article Views (full-text article views including HTML views, PDF and ePub downloads, according to the available data) and Abstracts Views on Vision4Press platform.
Data correspond to usage on the plateform after 2015. The current usage metrics is available 48-96 hours after online publication and is updated daily on week days.
Initial download of the metrics may take a while.