Fig. 3
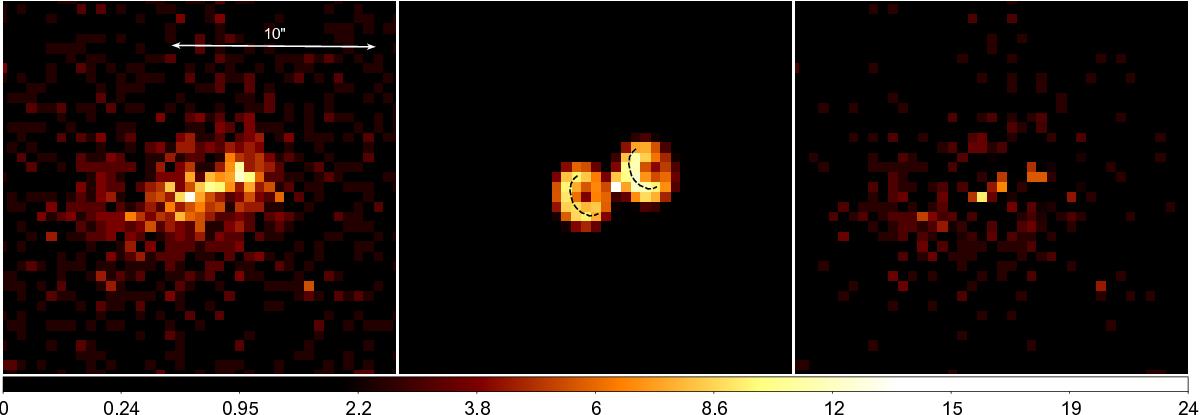
First panel: data in the energy range of 0.5–8 keV. Second panel: corresponding best-fit geometric model with a double torus (Ng & Romani 2008). The arcs of the torus are marked as black dashed lines to illustrate the geometry. The third panel displays the residuals after the best-fit has been subtracted.The colour bar is in square root, and units are counts for all the images.
Current usage metrics show cumulative count of Article Views (full-text article views including HTML views, PDF and ePub downloads, according to the available data) and Abstracts Views on Vision4Press platform.
Data correspond to usage on the plateform after 2015. The current usage metrics is available 48-96 hours after online publication and is updated daily on week days.
Initial download of the metrics may take a while.