Free Access
Fig. 2
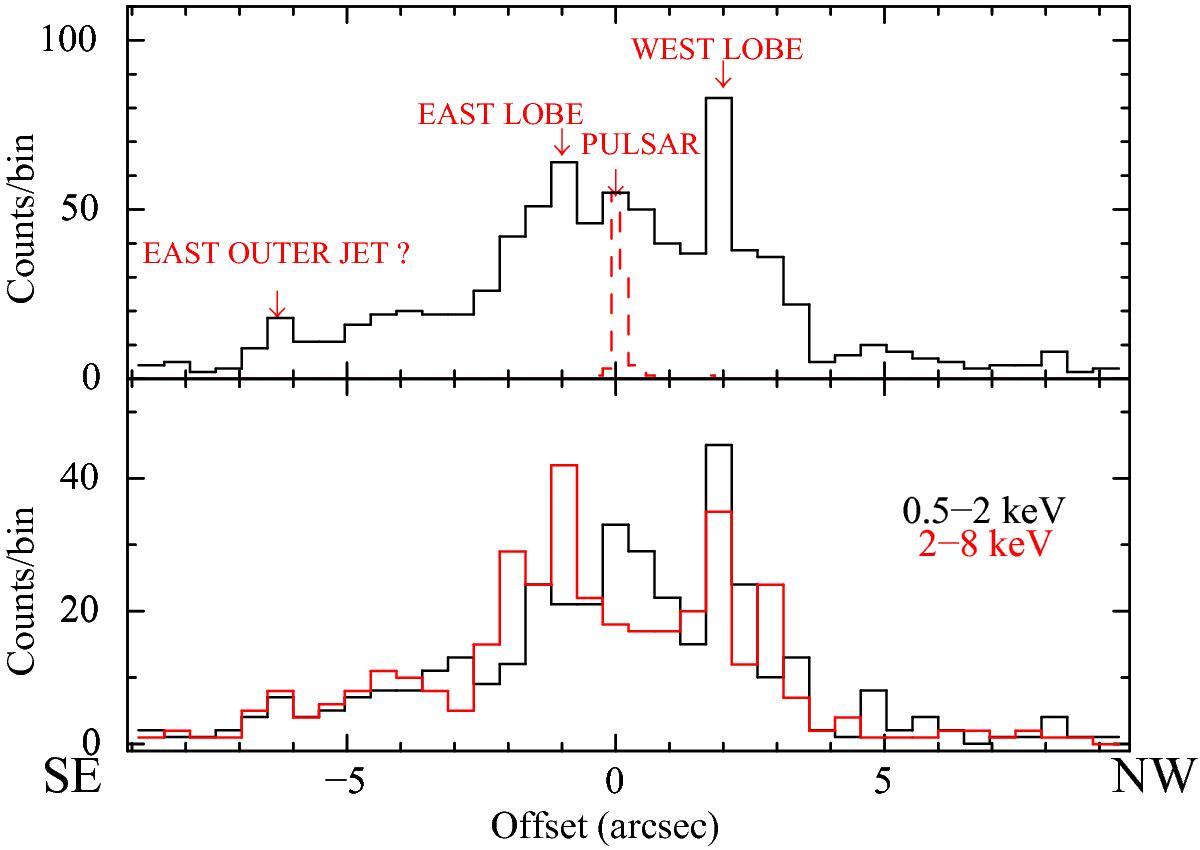
Top panel: counts profile of the source extracted from the box region in Fig. 1a (0.5–8 keV) compared with the 2D PSF (0.5–8 keV, red dashed line). The bottom panel portrays the same profile in the two energy bands 0.5–2 keV and 2–8 keV.
Current usage metrics show cumulative count of Article Views (full-text article views including HTML views, PDF and ePub downloads, according to the available data) and Abstracts Views on Vision4Press platform.
Data correspond to usage on the plateform after 2015. The current usage metrics is available 48-96 hours after online publication and is updated daily on week days.
Initial download of the metrics may take a while.